
Fig. 4.
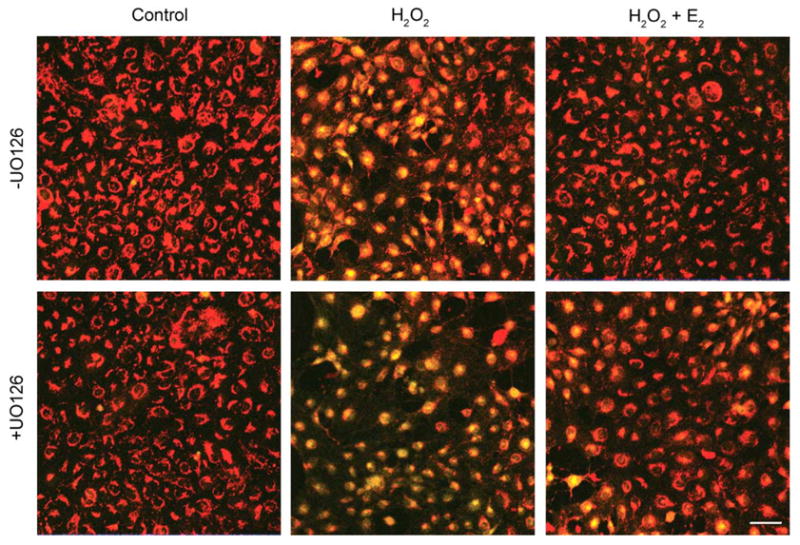
Confocal imaging of H2O2-induced mitochondrial membrane depolarization in HLE-B3 cells after 4 h. Following a 1 h pretreatment with 10 μM MEK1/2 inhibitor UO126 (+UO126) or DMSO vehicle (−UO126), cultures were treated with 100 μM H2O2±1 μM E2 (middle and right panels) and after 4 h stained with 5 μg/ml JC-1, a Δψm sensitive dye, for 30 min. Control cultures (left panels) received only UO126 or DMSO vehicle. Mitochondrial membrane depolarization is indicated by a shift from red to green fluorescence in H2O2-exposed cultures (middle panels). These images are typical of eight randomly chosen fields per treatment. Bar=20 μm.