
Fig. 7.
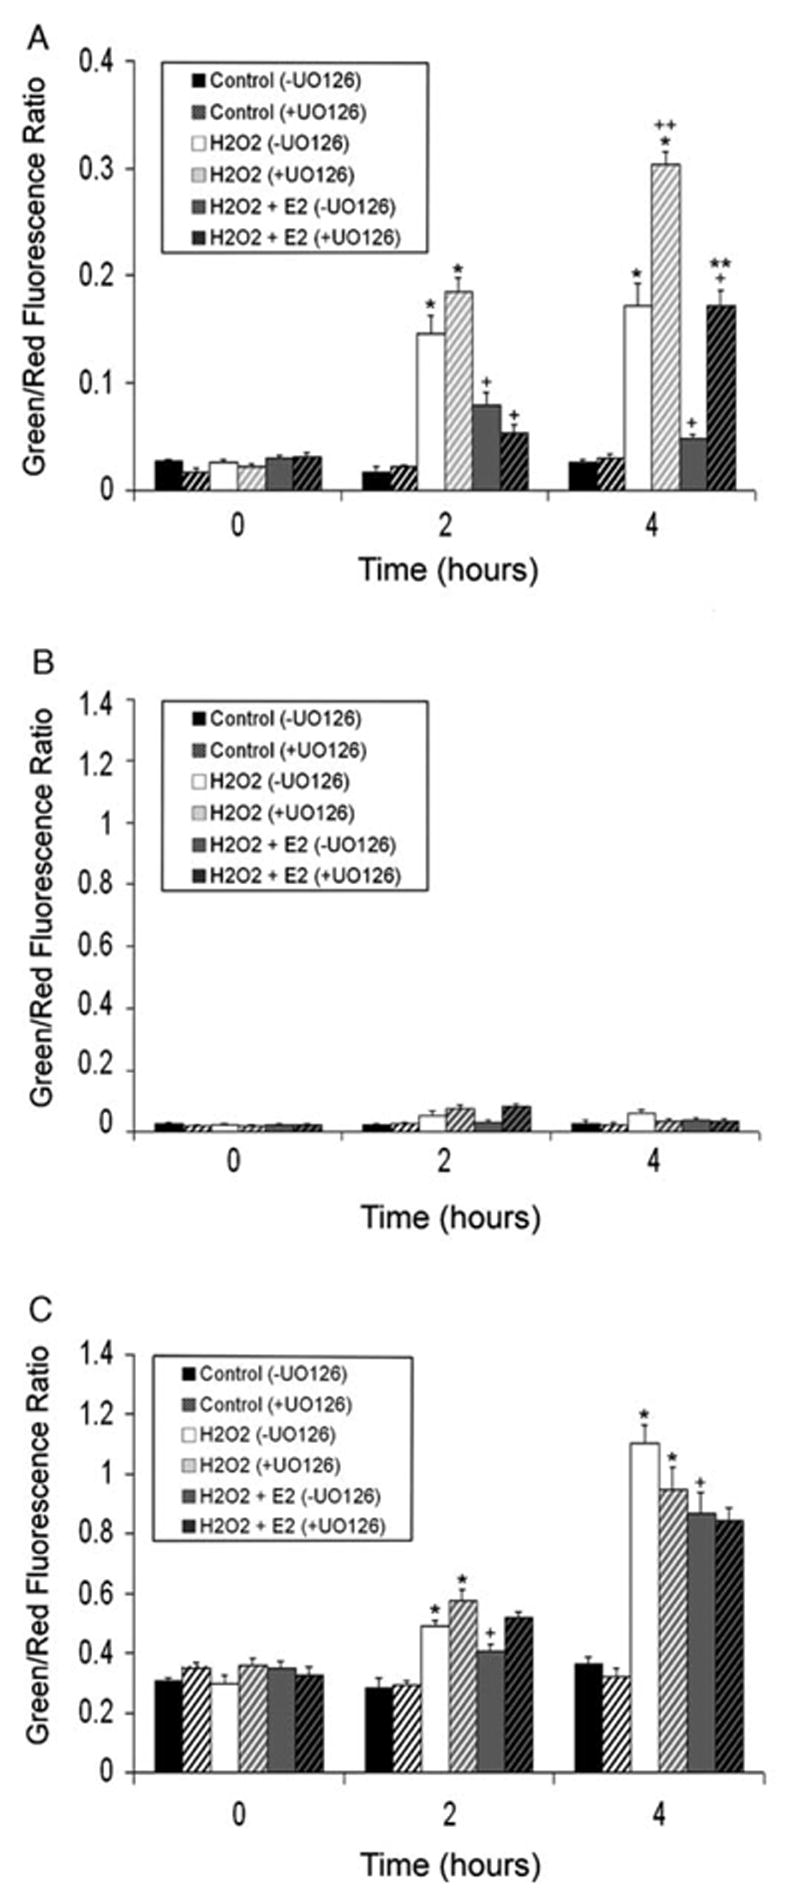
Quantitation of green and red fluorescence intensity from JC-1 images. Average green and red fluorescence values were calculated and ratios obtained. Bar graphs represent ratio data over the time course of 0, 2 and 4 h of 100 μM H2O2 exposure in (A) HLE-B3 cells, (B) BLECs and (C) BLECs+BSO. Data are presented as Mean±SE with n=8. (*) represents significantly different (P<0.001) from controls with the same treatment. (+) represents significantly different (P<0.02) from H2O2 with the same treatment. (**) represents significantly different (P<0.001) from H2O2+E2 (−UO126). (++) represents significantly different (P<0.001) from H2O2 (−UO126).