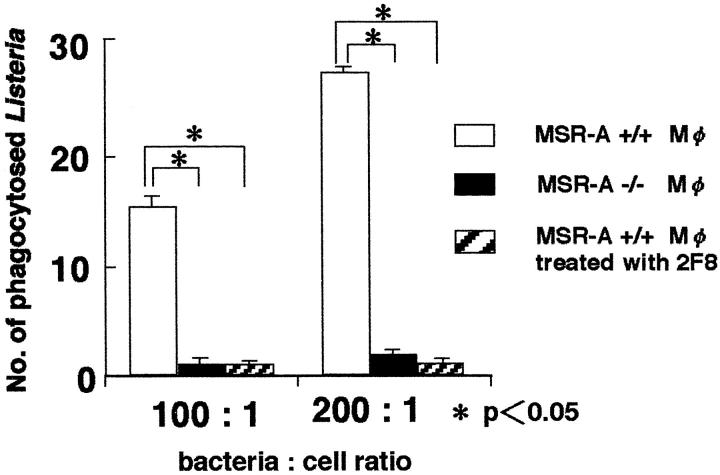
Figure 8.
The numbers of phagocytosed L. monocytogenes per cell of MSR-A+/+, MSR-A−/−, and 2F8-treated MSR-A+/+ peritoneal macrophages at 20 minutes after infection in vitro. The Listeria cell ratios were set at 100:1 (1 × 10 7 Listeria for 1 × 10 5 cells), and 200:1 (2 × 10 7 Listeria for 1 × 10 5 cells). Data are the mean for 100 cells in each group. *, P < 0.05.

