
Figure 3.
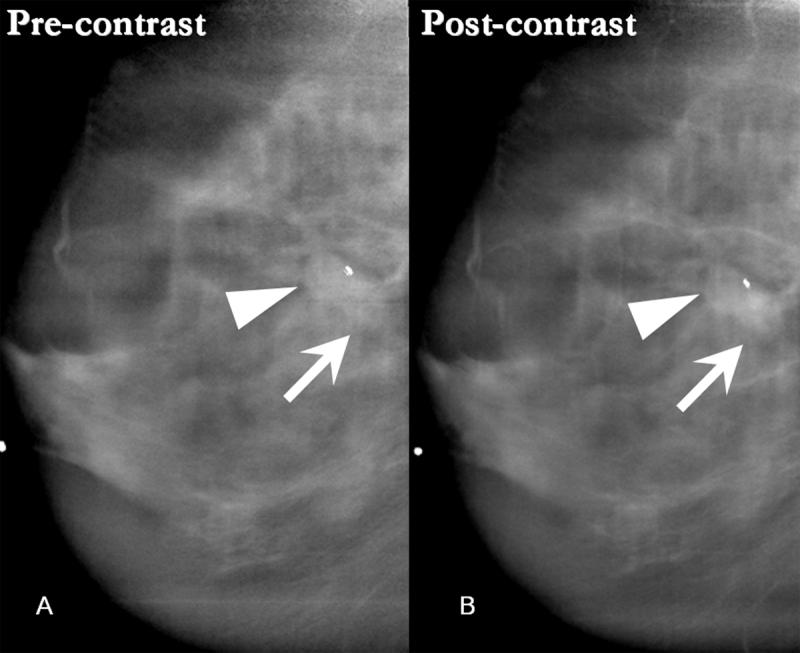
CE-DBT
- 3A: Inferoanterior to the biopsy clip, pre-contrast DBT demonstrates a density that is more conspicuous than on the digital mammogram (arrowhead). The cluster of calcifications identified on the digital mammogram is not well demonstrated here due to motion (arrow).
- 3B: Reconstructed post-contrast DBT images display an enhancing mass posterior to and separate from the density seen on pre-contrast images (arrow). This enhancing mass corresponds in location to the cluster of calcifications on mammography. The appearance corresponds to findings on breast MR (Figure 2), which demonstrates an enhancing suspicious mass adjacent to and separate from a non-enhancing post-biopsy hematoma (arrowhead).