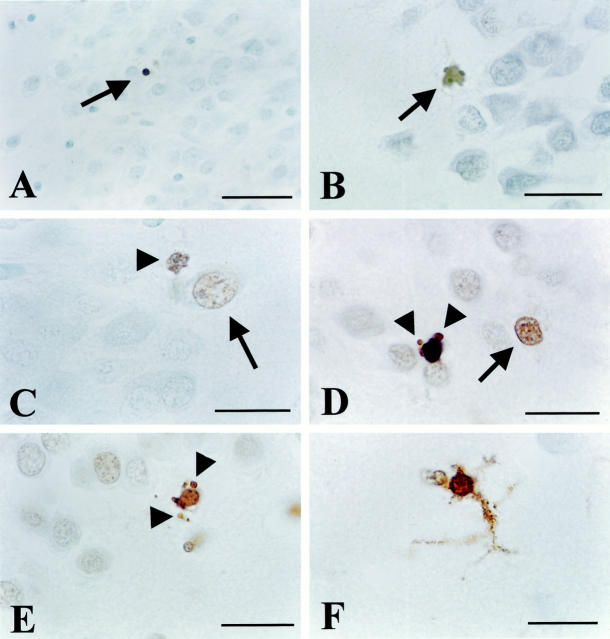
Figure 2.
ISEL results (continued from Figure 1 ▶ ). A: Isolated, ISEL-positive apoptotic cell with a clearly condensed size (arrow) in an otherwise ISEL-negative DG area of depressed patient 93-146. B: ISEL-positive apoptotic cell (arrow) in the DG of steroid-treated patient 95-11. C: Apoptotic cell (arrowhead) with clear membrane blebbing as well as a single apoptotic body visible, adjacent to an isolated ISEL-positive nucleus (large arrow) that appears necrotic, with a comparable size that seems even a little swollen, as compared to neighboring DG cells. Both cells are located on the inner border between the otherwise ISEL-negative DG and CA4. Depressed patient 93-090. D: Similar to C, an apoptotic cell close to a necrotic one (arrow). Clearly apoptotic bodies are indicated by arrowheads. Also, the enhanced levels of DNA fragmentation in some of the other cells is visible. Depressed patient 94-17. E: Apoptotic cell at the inner border of the DG of steroid-treated patient 83-004. Arrowheads indicate apoptotic bodies. F: Prominent ISEL labeling of a cell displaying glia morphology with DAB precipitate present throughout its protrusions. Steroid-treated patient 93-021. Scale bars: 42 μm (A), 25 μm (B), 16 μm (C–E), and 10 μm (F).

