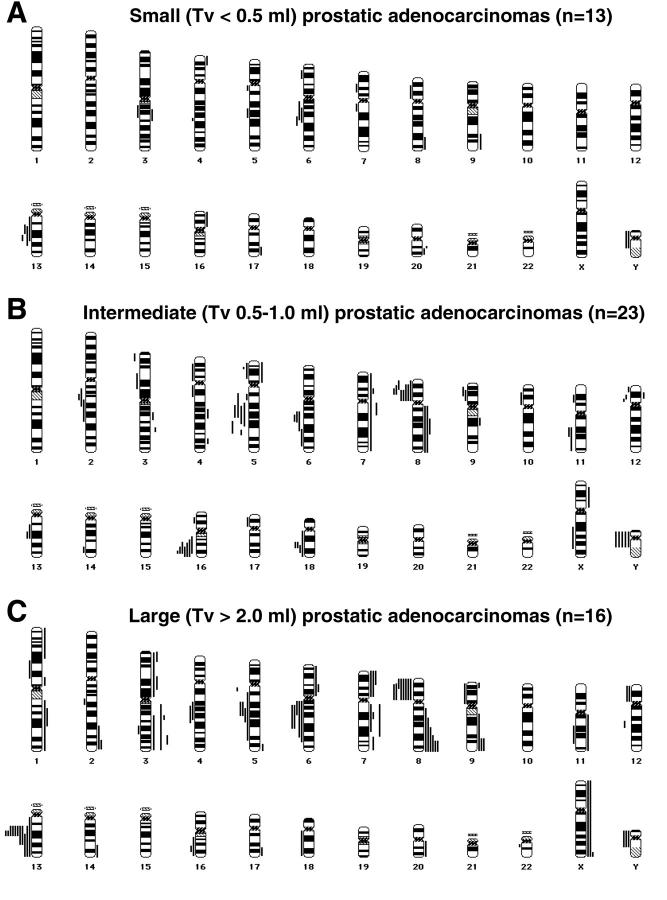
Figure 1.
Chromosomal ideograms showing the summary of DNA copy number changes, detected by CGH, in tumors of 52 patients with different tumor volumes. Losses are displayed on the left of the ideogram, gains are shown on the right. A: Small cancers (Tv < 0.5 ml; n = 13), showing loss of 6q, 13q, and Y, as well as gain of 20q. B: Intermediate cancers (Tv between 0.5–1.0 ml; n = 23), displaying loss of 5q, 6q, 8p, 16q, 18q, and Y. C: Large cancers (Tv > 2.0 ml; n = 16), revealing recurrent loss of 5q, 6q, 8p, 13q, and Y and frequent gain of 3q, 7pq, 8q, 9q, and Xq sequences.

