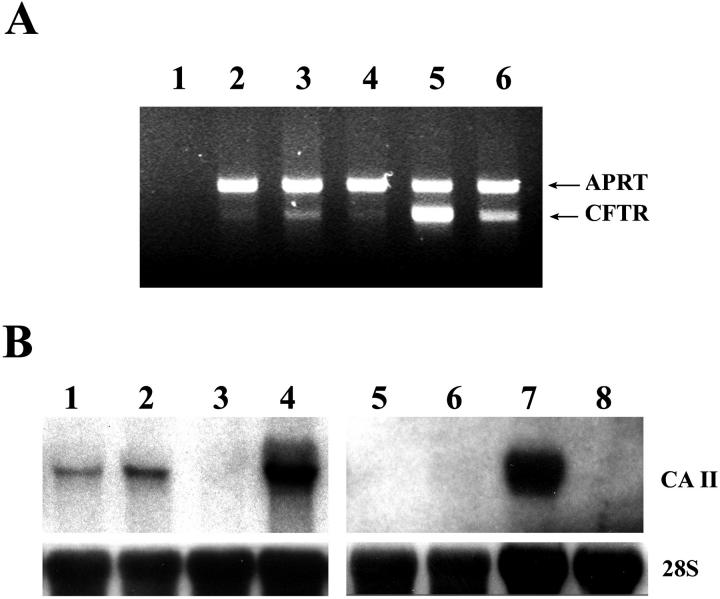
Figure 4.
Expression of CAII and CFTR in enriched pancreatic ducts and pancreatic duct epithelium primary culture. A: RT-PCR to estimate expression of CFTR mRNA compared with the housekeeping gene APRT. The RT-PCR product of APRT (642-bp band) amplified equally in all samples. The RT-PCR product of CFTR (488-bp band) was strongest in the sample of pancreatic duct epithelium culture (lane 5). Enriched pancreatic ducts (lane 3) had higher expression than whole pancreas (lane 2) or enriched acinar cells (lane 4). Lane 1: No RT control; lane 6: positive control, mouse kidney. B: Northern blot for comparison of CAII expression levels. Left: lane 1, whole pancreas; lane 2, enriched ducts; lane 3, enriched acinar cells; lane 4, mouse kidney, a positive control for the expression of CAII. Right: lane 5, whole pancreas; lane 6, enriched acinar cells; lane 7, cultured pancreatic duct epithelium; lane 8, enriched ducts placed in culture without collagen matrix.

