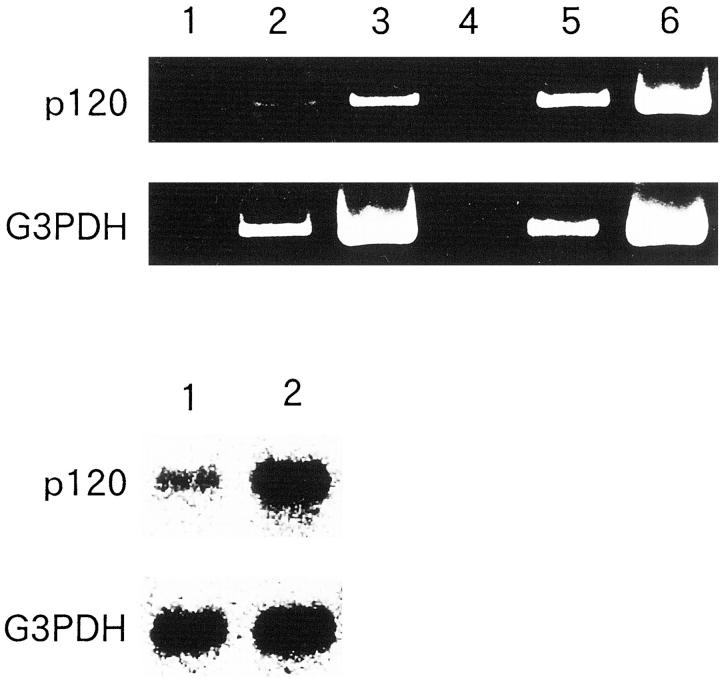
Figure 7.
RT-PCR and Northern blot of B120-transfected TGW neuroblastoma cells. Top: The plasmid alone-transfected TGW cells were applied to RT-PCR (lane 1, 10× cycles; lane 2, 15× cycles; lane 3, ×25 cycles of PCR after RT reaction) with p120 or G3PDH primer sets. B120-transfected cells were also examined by RT-PCR (lane 4, 10× cycles; lane 5, 15× cycles; lane 6, 25× cycles of PCR after RT reaction). Overexpression of p120 in B120-transfected TGW cells was demonstrated by RT-PCR. Note the even intensity of internal control bands of G3PDH in both B120-transfected and plasmid alone-transfected TGW cells. Bottom: Northern blot analysis of plasmid alone-transfected and B120-transfected TGW cells (lanes 1 and 2, respectively). Northern blot analysis also demonstrated the overexpression of p120 gene in B120-transfected cells. Note the even intensity of G3PDH band in lanes 1 and 2.

