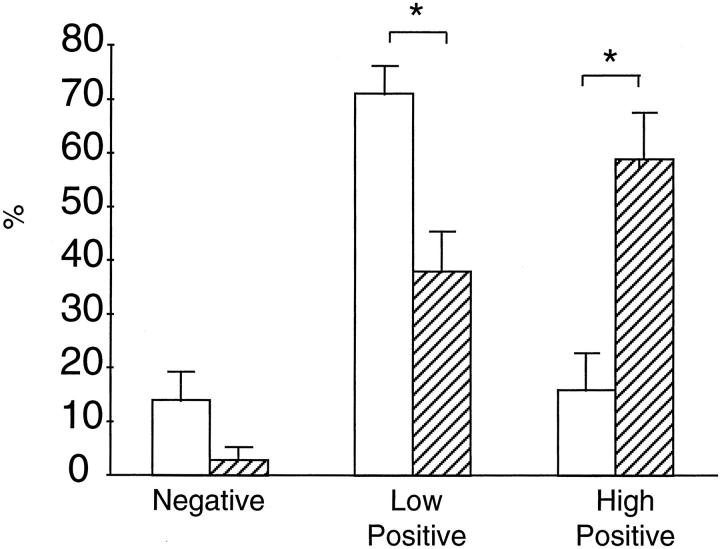
Figure 12.
Quantitation of HO-1 staining in CECs derived from healthy controls (open column, n = 4) and patients with sickle cell disease (striped column, n = 5). As described in the text and shown in Figure 11 ▶ , staining for HO-1 is categorized as “negative,” “low positive,” and “high positive.” *, P < 0.05, healthy control patient versus patients with sickle cell disease for that category of HO-1 staining.

