
Figure 2.
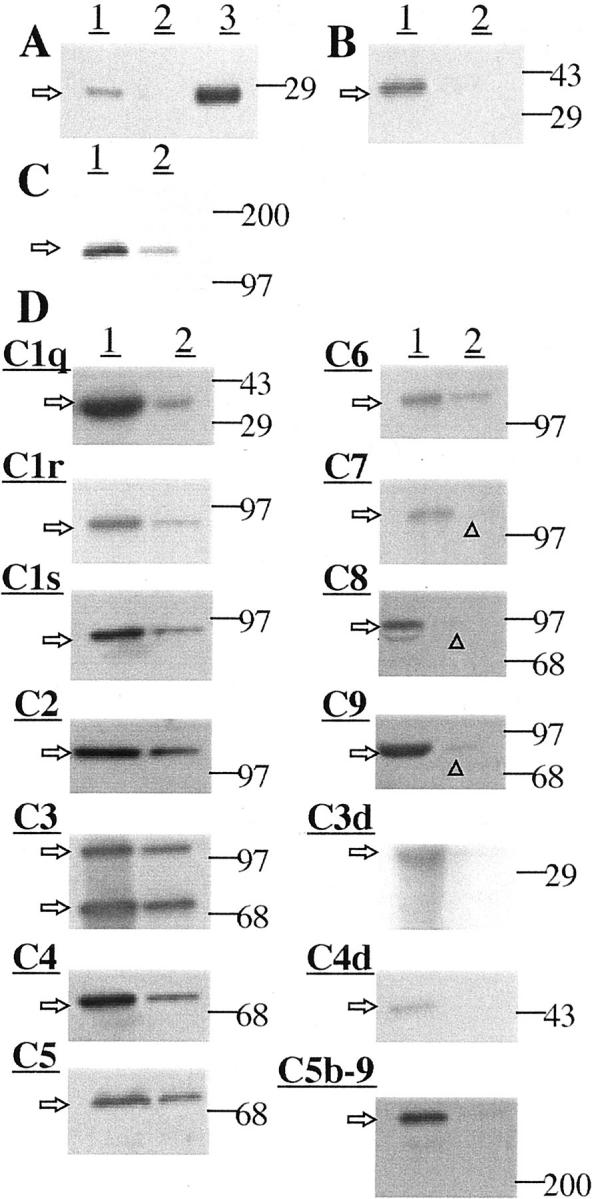
Western blot data for protein extracts of various tissues (see Materials and Methods for details). Arrows on the left indicate the size of observed bands; lines on the right point to the positions of size markers used to estimate molecular weights. A: Detection of CRP. Lane 1, plaque extract; lane 2, normal arterial extract; lane 3, 0.5 μg of CRP protein as a standard. Notice a detectable band at ∼ 28 kd in plaque extract. There was no detectable band in normal arterial extract. An intense band was obtained for 0.5 μg of CRP standard. B: Detection of CD11b. Lane 1, atherosclerotic plaque extract; lane 2, normal arterial extract. A strong band was obtained for atherosclerotic plaque extract, at ∼155 kd with no detectable band for normal arterial extract. C: Detection of HLA-DR. Lane 1, atherosclerotic plaque extract; lane 2, normal arterial extract. A strong band of ∼35 kd was obtained in plaque extract, and a weak band for normal arterial extract. D: Detection of complement proteins. In all cases, lane 1 is for atherosclerotic plaque extract and lane 2 for normal arterial extract. Strong bands were obtained for all components in atherosclerotic plaque extracts (C1q, ∼35 kd; C1r, ∼85 kd; C1s, ∼85 kd; C2, ∼110 kd; C3, ∼115, 75 kd; C4, ∼75 kd; C5, ∼75 kd; C6, ∼120 kd; C7, ∼115 kd; C8, ∼85 kd; C9, ∼80 kd). Also detected were bands for the activated complement fragments C3d, ∼35 kd; C4d, ∼45 kd; and C5b-9. Weaker bands were obtained for normal arterial tissue, except for the activated components C3d, C4d, and C5b-9. The very faint bands are indicated by arrowheads.