
Figure 7.
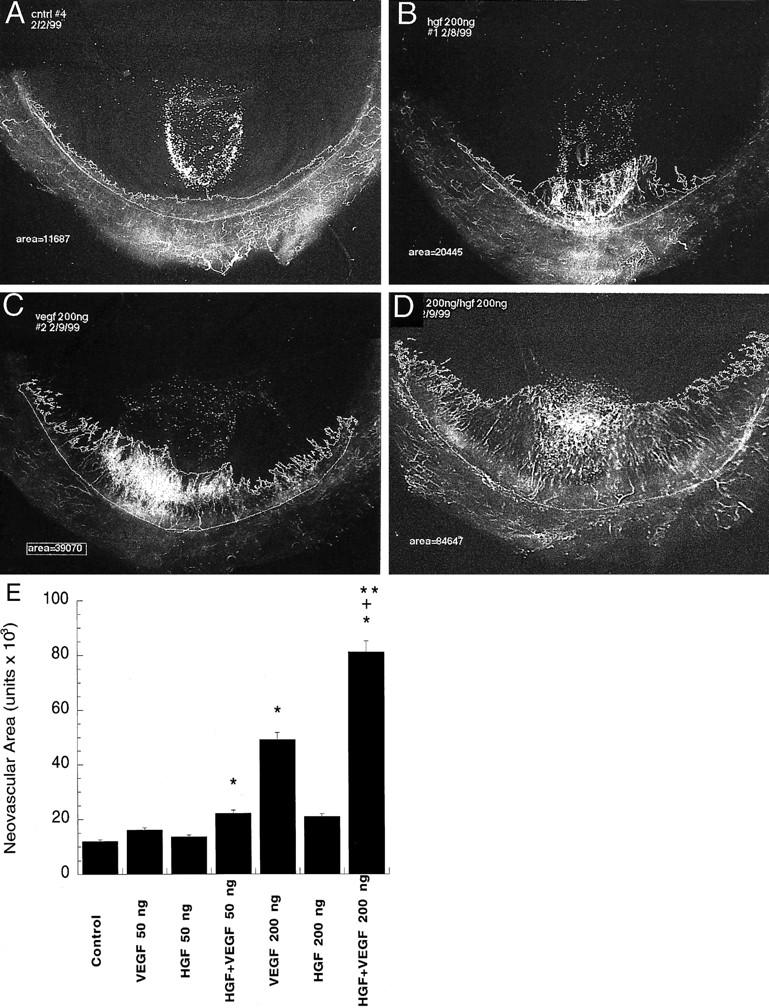
. Representative photomicrographs of the effects of VEGF and HGF alone and in combination on angiogenesis in vivo. A–D: Representative flat-mount photomicrographs of rat corneas 6 days after implantation of hydron pellets A: Control, excipient alone. B: HGF (200 ng/ml). VEGF (200 ng/ml) (C) and VEGF (200 ng/ml) and HGF (200 ng/ml) in combination (D). E: Summary data of the in vivo angiogenic response to control, VEGF-, HGF-, and VEGF and HGF-treated groups. Data are expressed as mean ± SE, n = 5 animals/group. *, Significantly different from control; **, significantly different from VEGF alone. +, Significantly different from HGF alone (Mann-Whitney test for nonparametric values).