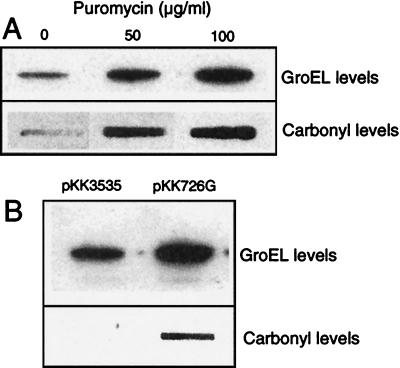
Figure 3.
Correlation between mistranslation and protein carbonylation. Two methods to induce mistranslation were tested: (A) addition of various puromycin concentrations and (B) transformation of cells with pKK726G which contains a single base change in 16S rRNA (C-726 to G) and a control plasmid, pKK3535, which contains the complete E. coli rrnB operon. Because MG1655 carrying pKK726G has a temperature-sensitive phenotype, cells were grown at 30°C. Quantification of carbonyl content and GroEL levels was performed as described in the legend to Fig. 1. The analysis was repeated three times to confirm reproducibility. Representative results are shown and SD was always <20%.

