Figure 8.

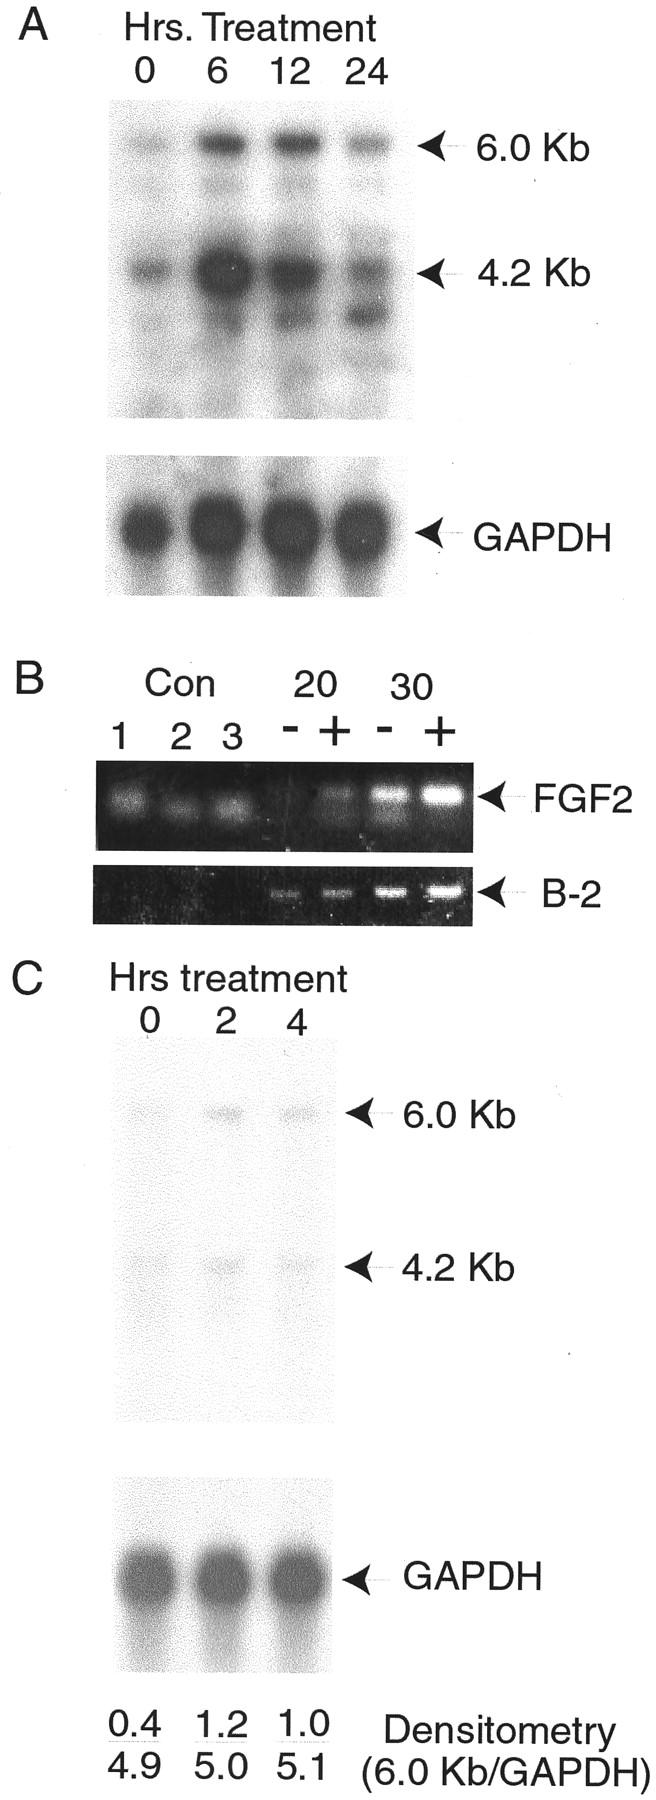
Induction of FGF2 mRNA by IL-8 and epithelial-conditioned medium. A: Primary stromal cells were treated for 6, 12, or 24 hours with 200 pg/ml of recombinant IL-8 or not treated (0 hours). RNAs were extracted and 10 μg/ml of total RNA from each treatment analyzed by Northern blotting with a FGF2 cDNA probe. After autoradiography major bands of 6.0 and 4.2 kb were detected (indicated by arrows), as well as a minor band of 3.1 kb. Control hybridization with glyceraldehyde-3′-phosphate dehydrogenase was performed to control for variation in RNA loading and transfer. B: Primary stromal cells were treated with recombinant IL-8 as described above, RNA isolated, and analyzed by reverse transcriptase-polymerase chain reaction. Control reactions were water (control 1), and RNAs from untreated or treated cells without reverse transcription (controls 2 and 3). Reverse-transcribed RNAs were subject to the indicated number of cycles of polymerase chain reaction before analysis by agarose gel electrophoresis. Reactions from RNAs of cells treated with IL-8 are indicated by (+), untreated samples by (−). Bands corresponding to the predicted size (349 bp) for the specific product from the FGF2 cDNAs are indicated. A smaller nonspecific band is also seen. The bands corresponding to the control β-2 microglobulin polymerase chain reaction products of 125 bp from the same reactions are also shown (B-2). C: Cells were treated with a 1:10 dilution of epithelial-conditioned medium for 2 or 4 hours or not treated (0 hours) and RNAs analyzed by Northern blotting as described in A above using FGF2 and control glyceraldehyde-3′-phosphate dehydrogenase cDNA probes. Results of densitometry using a Molecular Dynamics PhosphorImager are shown in each lane, expressed as the ratio of the intensity of 6 kb FGF2 band over the intensity of the glyceraldehyde-3′-phosphate dehydrogenase band.
