
Figure 1.
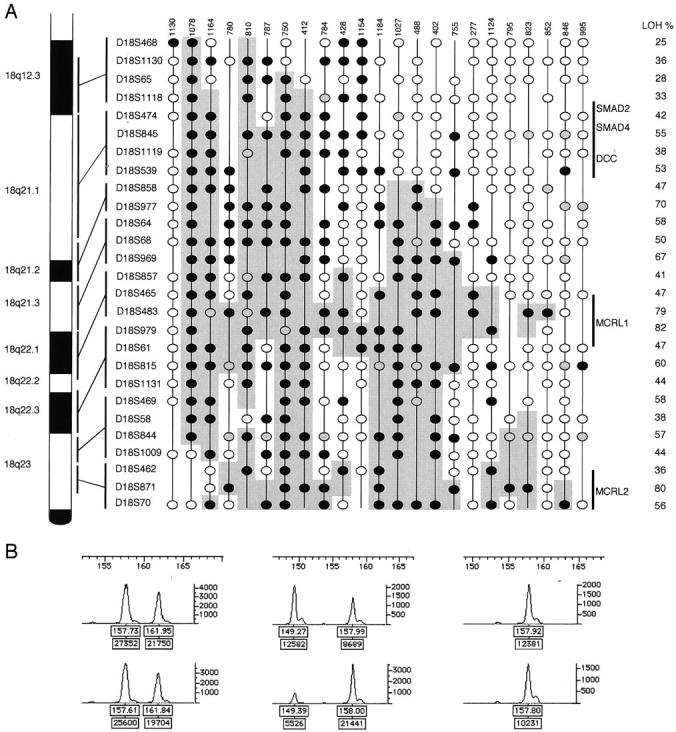
A: Deletion map of 23 serous ovarian carcinomas showing partial deletion (36%) of chromosome arm 18q. The 15 (23%) serous carcinomas with LOH at all informative markers and the 26 (41%) carcinomas with no LOH are not shown. The genetic order and the approximate loci of 27 microsatellite markers are shown on the right side of the chromosome 18q figure. Each vertical column represents one tumor sample; case number shown on the top. Frequency of allelic loss (LOH/informative) at each marker is presented on the right. Black circle, LOH; white circle, informative with no loss; gray circle, not interpretable; vertical line, not informative. Shaded area, potential deletions including the minimal common regions of loss (markers showing LOH and flanking noninformative markers). MCRL1 and MCRL2, minimal common regions of loss. B: Representative examples of LOH assessment, marker D18S979; left, informative with no loss, case 1130; middle, LOH, case 1078; right, not informative (homozygous), case 1164; size in bp is shown on the x axis at the top of each figure. The peak heights in fluorescence units are shown on the y axis on the right of each figure. In each figure the upper trace is amplification from normal tissue and the lower trace amplification from tumor tissue. Each peak has two labels (boxes): upper label, size in bp; lower label, peak area.