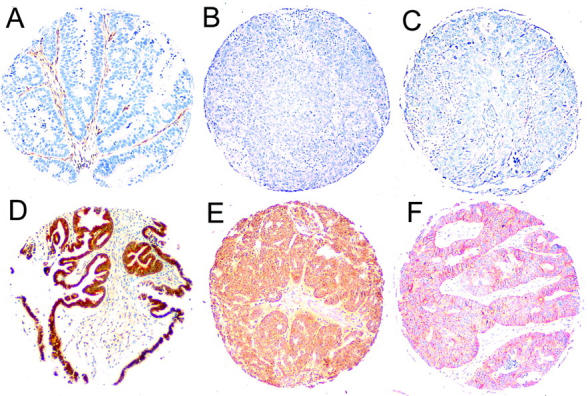
Figure 3.

Immunohistochemical staining of SMAD4 (A and D), SMAD2 (B and E), and DCC (C and F) in serous ovarian carcinoma specimens on tissue microarray (original magnification, ×20). Top: Examples with negative or weak immunoreactivity (A–C). Bottom: Examples with positive immunoreactivity of the carcinoma cells (D–F).
