
Figure 7.
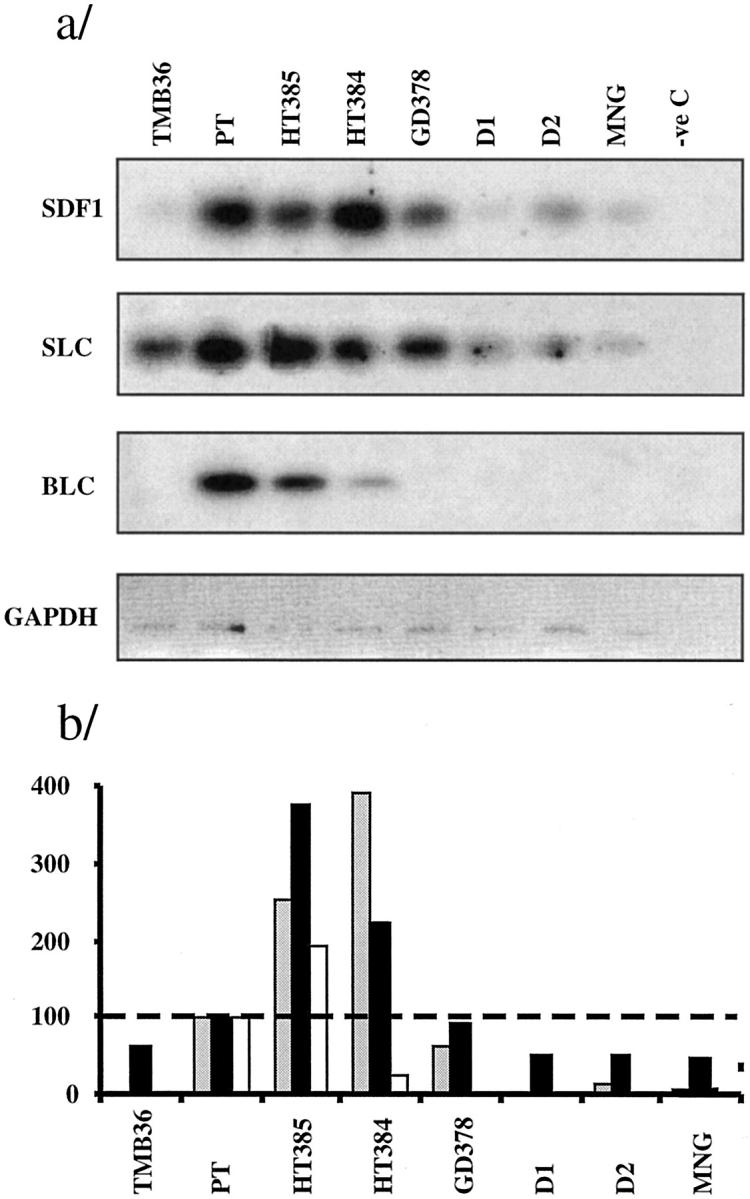
Chemokine expression as assessed by RT-PCR-Southern blot and phosphorimager counting. a: RT-PCR-Southern blots. b: Ratio for normalized chemokine value in each gland: normalized tonsil value, ×100; the broken line at 100% represents the tonsil reference value. Gray bars, SDF1 (CXCL12); solid bars, SLC (CCL21); open bars, BLC (CXCL13). TMB, thymus; D1 and D2, normal donors.