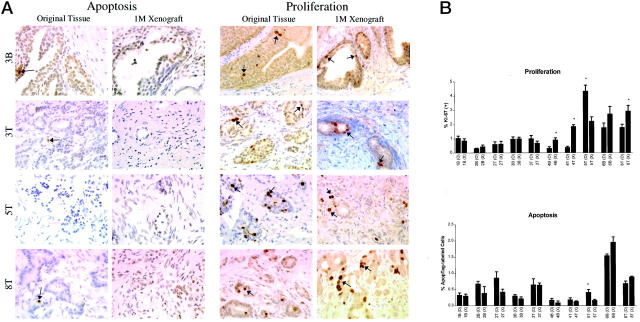
Figure 2.
Apoptosis and proliferation were evaluated in the original tissues and corresponding 1-month xenograft tissues. Representative samples are shown in A. The percentages of Apoptag-labeled cells (dark-brown nuclei) were equivalent in 9 of 10 matched original and xenograft tissues (B). Proliferative cells, as identified by antibodies to Ki67 (dark-brown nuclear staining), were detected in matched original and xenograft tissues. The proliferative fraction was significantly higher in 3 of 10 xenografts when compared to matched original tissue, and was significantly lower in one xenograft.

