
Figure 3.
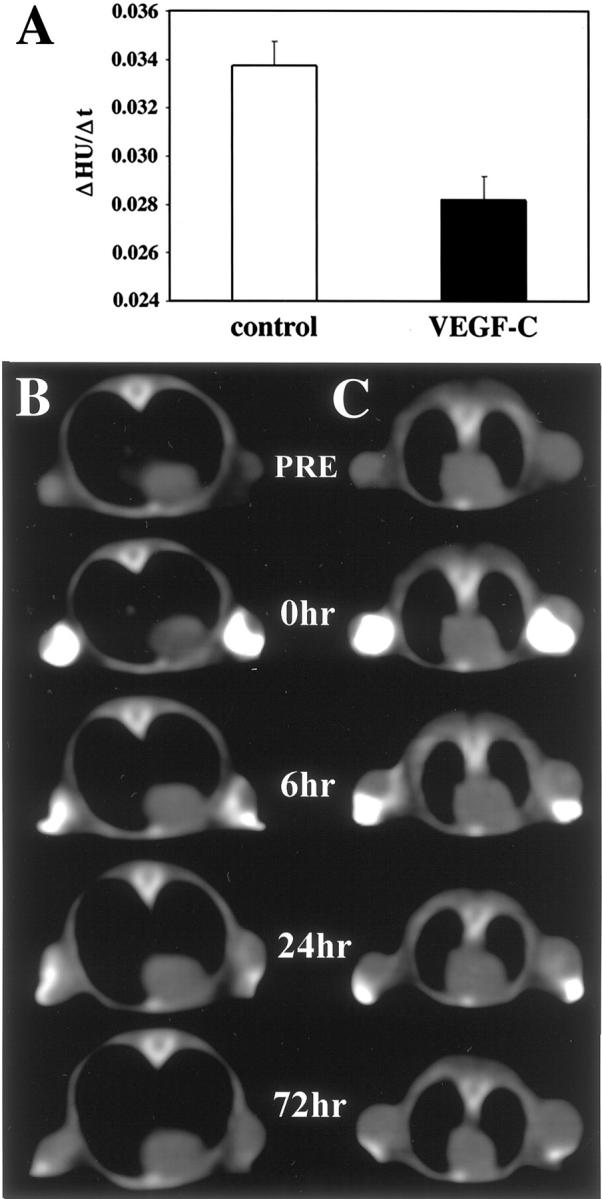
Impaired clearance of the lymphographic contrast agent from VEGF-C-overexpressing MeWo tumors. Contrast agent was injected into the tumors and the images of tumors were obtained with a computed tomography scanner for up to 72 hours after injection. A: Signal intensity values, expressed as Hounsfield units, were plotted against time and the clearance rate constant (ΔHounsfield units/Δt) was calculated for each tumor. The data are expressed as the mean values ± SD of six tumors for each tumor type. Representative images of control (B) and VEGF-C-overexpressing tumors of comparable size (C), obtained before (PRE) and after injection of the contrast agent (0 to 72 hours).