
Figure 5.
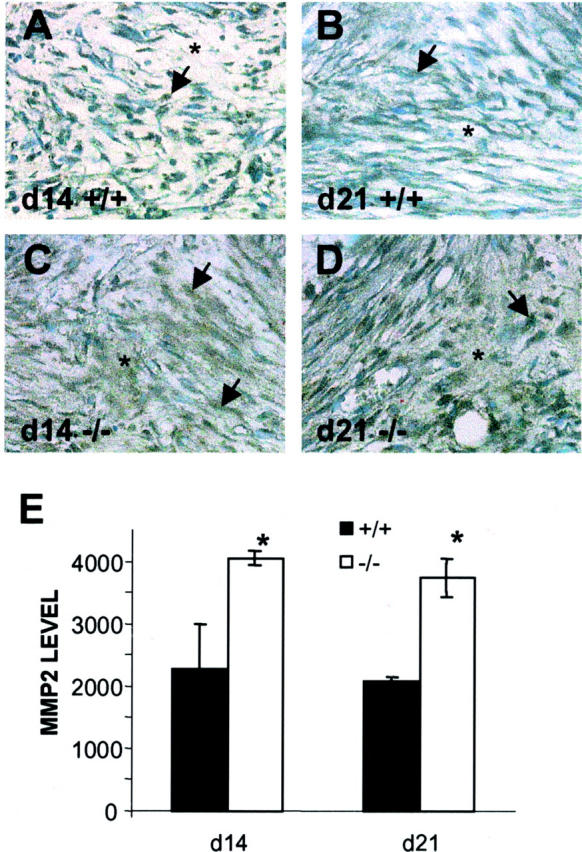
ECM-associated MMP2 is increased in TSP2-null mice. A–D: Sections from day 14 (A, C) and day 21 (B, D) sponges from control (A, B) and TSP2-null (C, D) mice were stained with an anti-MMP2 antibody and visualized by the peroxidase method. Arrows and asterisks denote immunoreactive cells and matrix, respectively. Increased MMP2 deposition in the ECM was evident in TSP2-null sections (C, D). Original magnifications, ×400. E: Histomorphometric quantification of MMP2 deposition. Relative levels of MMP2 at day 14 and day 21 in sponges of control (solid bars) and TSP2-null (open bars) mice. Values are arbitrary units. *, P ≤ 0.05.