Figure 5.

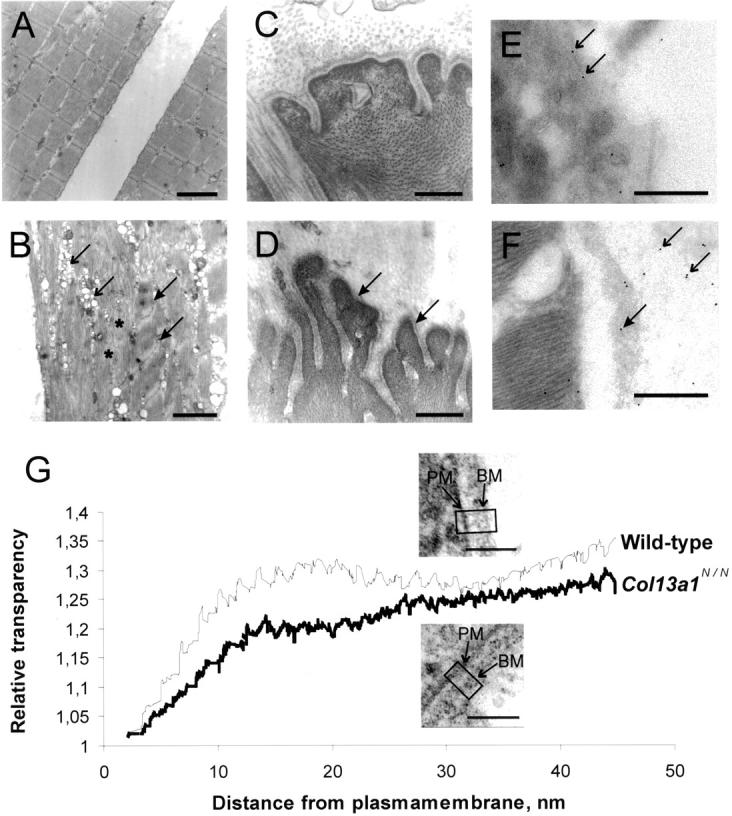
Transmission electron microscopy and immunoelectron microscopy of wild-type and Col13a1N/N skeletal muscle. Samples of the MQF from 43-week-old wild-type (A and C) and Col13a1N/N mice were prepared for electron microscopy (B and D). In the mutant case the myofibrils (asterisk) are disorganized and there is z-band streaming (filled arrows) and vacuolization (arrows) indicating muscle cell degeneration (B). The basement membranes attached to the muscle fibers are abnormal, this being most clearly visible at the myotendinous junctions (filled arrows in D). Samples of the m. gastrocnemius from 24-week-old wild-type (E) and Col13a1N/N (F) mice were used for immunoelectron microscopy with the antibody anti-mouse XIII/NC3. In wild-type samples most of the staining is localized to the plasma membrane (arrows in E) whereas in the mutant most of the staining can be seen in the detached basement membrane (filled arrow in F) and adjacent extracellular space (arrows in F). In G the relative transparency is plotted against the distance from the plasma membrane toward the extracellular matrix. The values are normalized as indicated in Materials and Methods. Insets: Wild-type (top) and lower Col13a1N/N (bottom) demonstrate areas used for the density measurements. The curves summarize the results for a total of 19 mutant and 17 control cells. PM and BM indicate plasma membranes and basement membranes, respectively. Scale bars: 2 μm (A and B), 400 nm (C–F), 100 nm (G).
