
Figure 1.
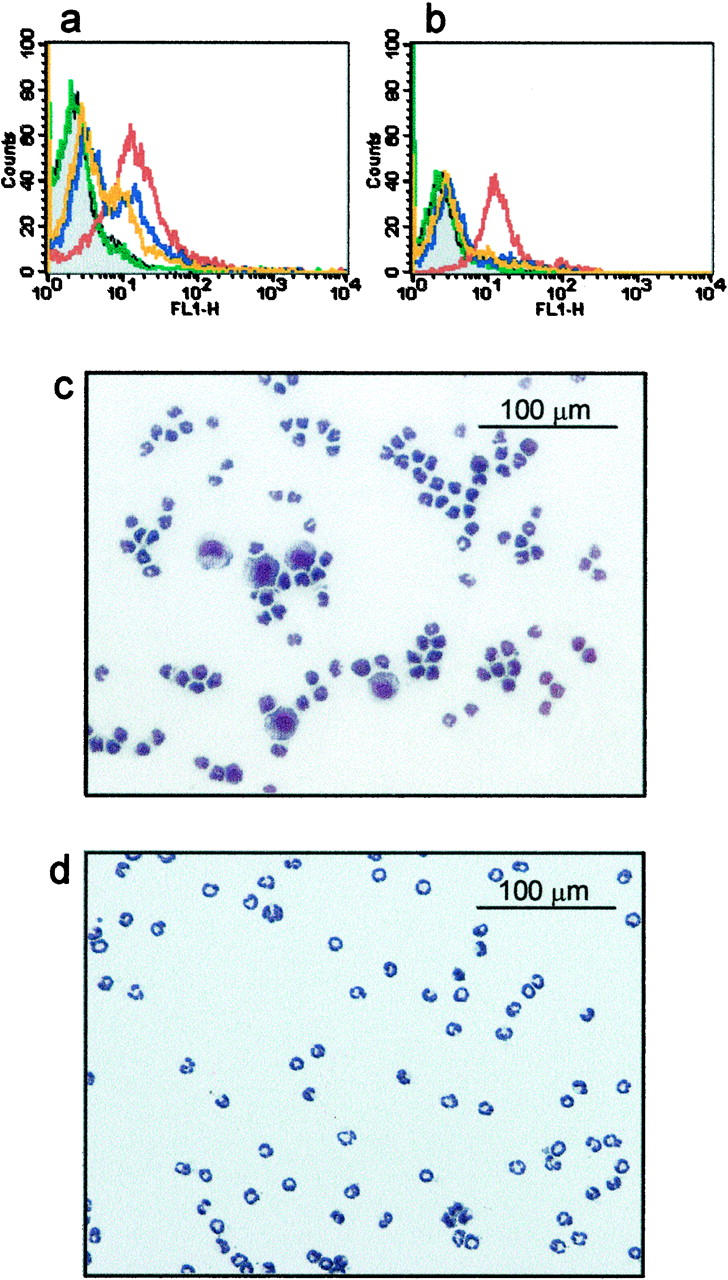
Flow cytometric analysis of primary antibody binding and typical cytospins with and without the use of anti-ICAM-1. Doses of each primary antibody (for example anti-ICAM-1 shown here) were determined by measuring fluorescence intensities of a fluorescent secondary antibody (anti-rat IgG). a: Whole-blood leukocytes incubated with higher doses of anti-ICAM-1 demonstrated increased binding of secondary antibody (gray, autofluorescence; green, isotype control; orange, 0.2 μg of anti-ICAM-1/10 6 cells; blue, 0.6 μg of anti-ICAM-1/10 6 cells; red, 1.8 μg of anti-ICAM-1/10 6 cells). b: The neutrophil subpopulation (separately identified by Ly-6G staining), however, also showed anti-ICAM-1 binding at the highest dose (1.8 μg of anti-ICAM-1/10 6 cells). Consequently, primary antibody doses were selected that gave optimal neutrophil purity and yield. c and d: Cytospins of isolated neutrophils stained with Diff-Quick after negative immunomagnetic separation. The efficacy of ICAM-1 to deplete monocytes is evident from cytospins of cell isolates where anti-ICAM-1 (0.6 μg/10 6 cells) has been excluded or included in the primary antibody cocktail (c and d, respectively). Original magnifications, ×200.