
Figure 4.
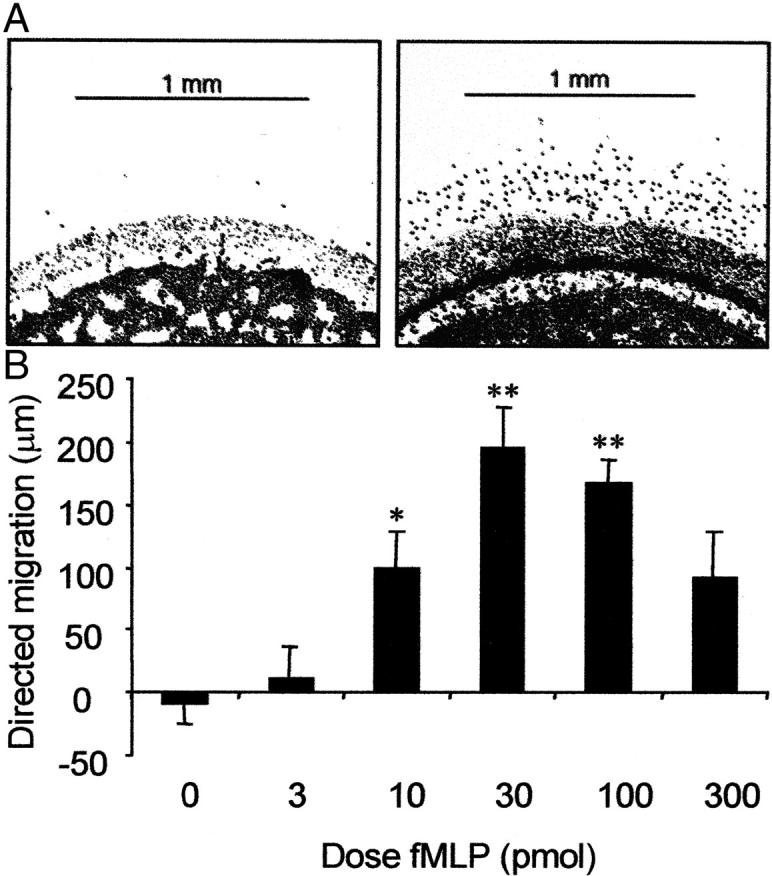
A: Photomicrographs of stained neutrophils showing in vitro migration of isolated neutrophils toward fMLP. In each frame cell wells are perpendicular to chemoattractant wells (top; not shown). Left: Cells in control plates were not exposed to a fMLP gradient and displayed minimal migration. Right: An optimal dose of fMLP (30 pmol) induced a distinct migratory response from isolated neutrophils toward the chemoattractant source. B: Distance of directed migration under agarose by isolated neutrophils in response to increasing concentrations of fMLP after incubation at 37°C for 2.5 hours. To determine directed migration, spontaneous migration (chemokinesis) was subtracted from the distance migrated toward the chemoattractant source. Data are presented as mean ± SEM (n = 4). Data were analyzed for statistical significance using a two-way analysis of variance followed by Dunnett’s t-test. *, P < 0.05; **, P < 0.01 compared with control.