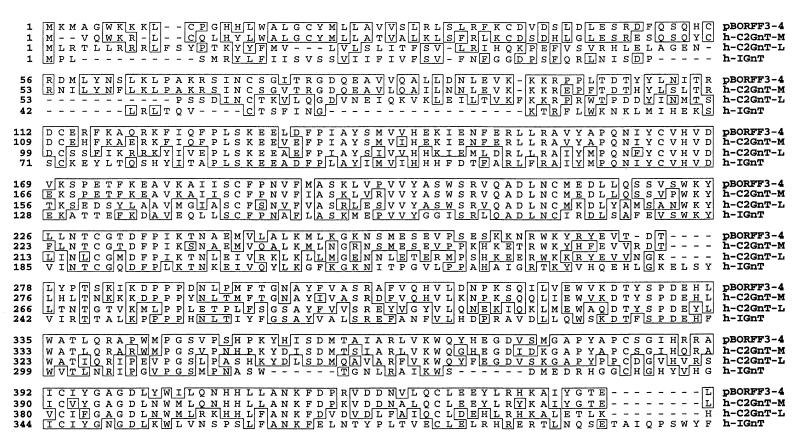
Figure 2.
Homology among pBORFF3–4, h-C2GnT-M, h-C2GnT-L, and h-IGnT. The four proteins were compared by using a clustal alignment program. The amino acid residues are numbered with respect to the translation initiation methionine. Identical residues are indicated by boxes. Dashes represent gaps in the sequence.

