
Figure 3.
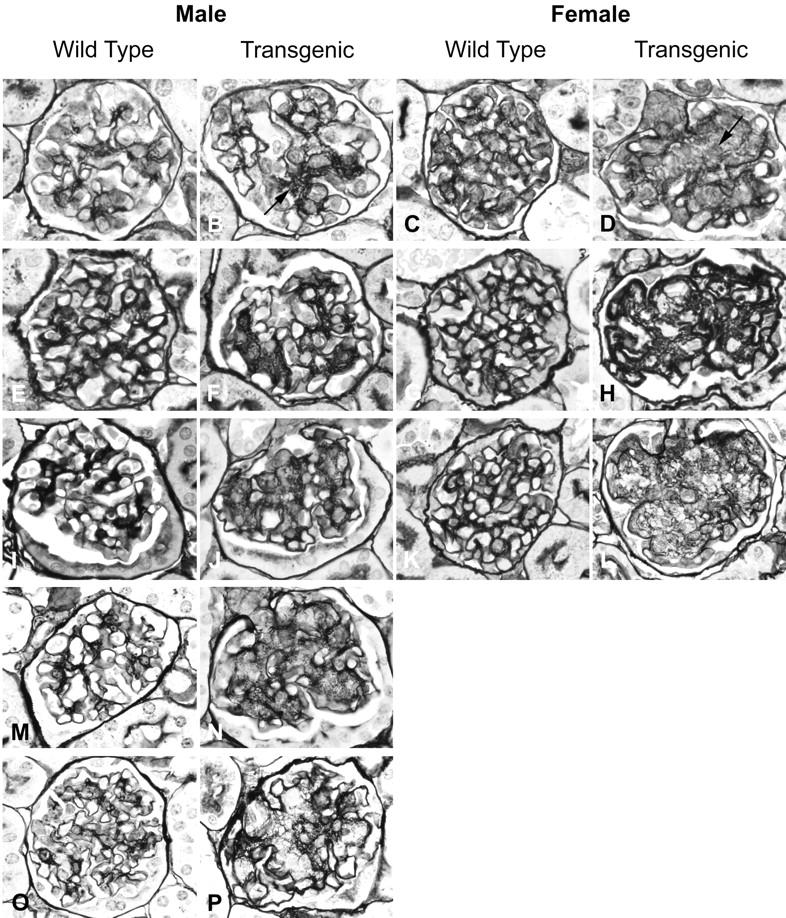
Time course of the renal involvement in TSLP transgenic mice. The figure illustrates the time course of the renal lesions in monthly intervals. Columns one and three represent the age-matched wild-type controls. The specimens are from mice at the age of ∼1 month (A–D), 2 months (E–H), 3 months (I–L), 5 months (M and N), and 7 months (O and P). Note the increase of mesangial matrix, which shows a severer course in female mice (arrow).