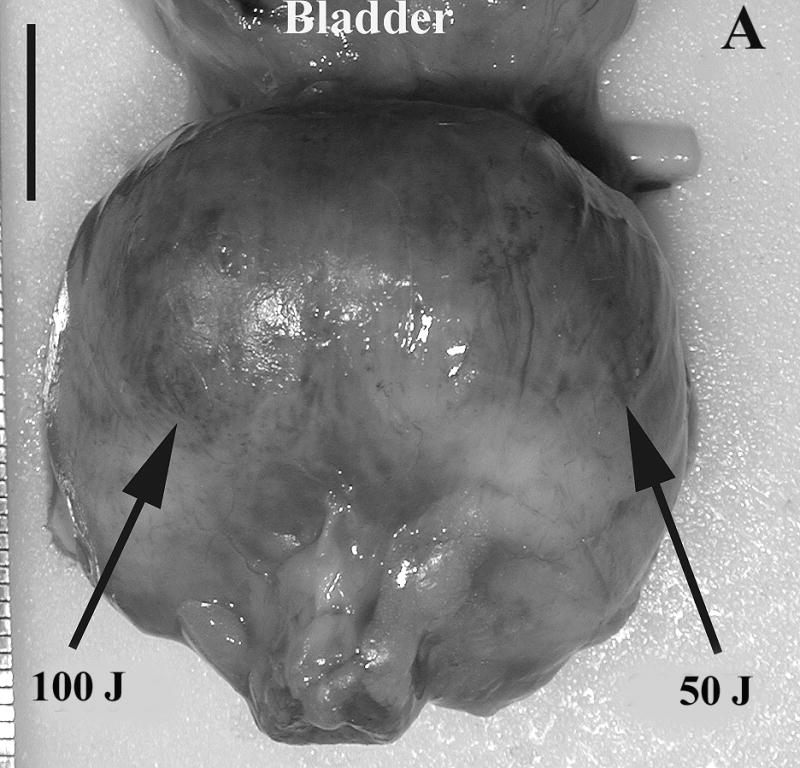
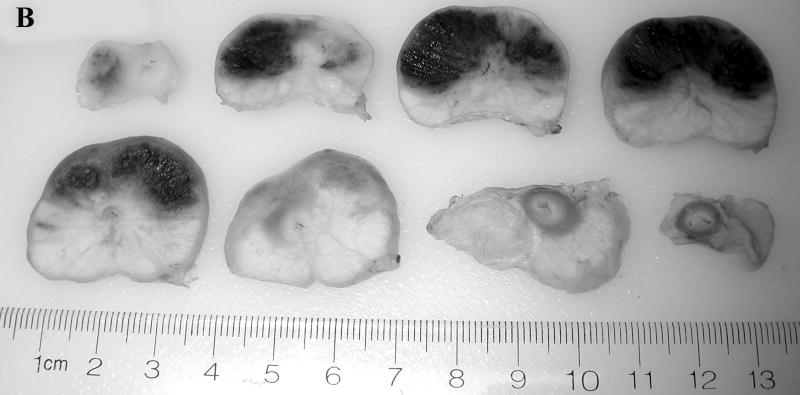
Fig. 1.

Prostate 7 days after Tookad-PDT. A: Gross view of the prostate of Dog #1 prior to formalin fixation. Patchy sub-capsular hyperemia was visible at both lobes. B: Dissected view of the same prostate after formalin fixation. Images are displayed with the dog’s anatomic left on the right side of the image. The left lobe received 50 J/cm and the right lobe 100 J/cm. Dark regions correspond to the PDT-induced hemorrhagic necrosis. (Bar = 1 cm).

