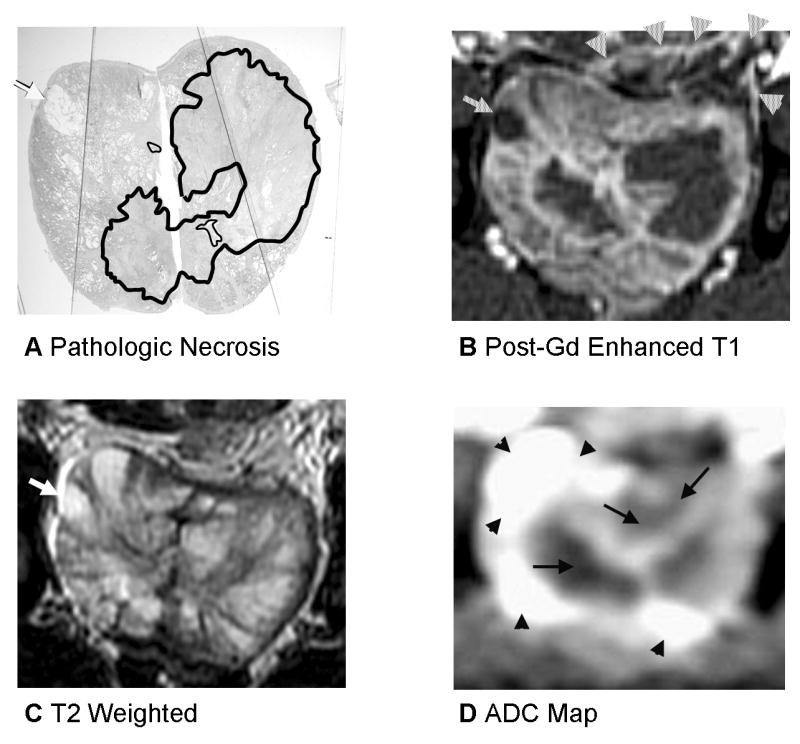
Fig. 4.

Prostate 7 days after Tookad-PDT with heterogenous signal changes on T2 and ADC and deformation from periprostatic hemorrhage. A: Pathologic slide (Dog #3, the left lobe received 300 J/cm and the right lobe 200 J/cm). Similar histopathological findings as described in the Figure 2. Images are displayed with the dog’s anatomic left on the right side of the image. B: Post-gadolinium-enhanced T1-weighted images shows necrotic region well. Cyst is demonstrated as a dark region as well (arrow) and is recognizable and was present on baseline images as well. There is compression of the prostate by periprostatic fluid and hemorrhage on the left (arrowheads). C: On T2-weighted images, the region of necrosis is not denned at all. D: ADC map shows heterogenous ADC changes on the left (same scale as the Fig. 2).
