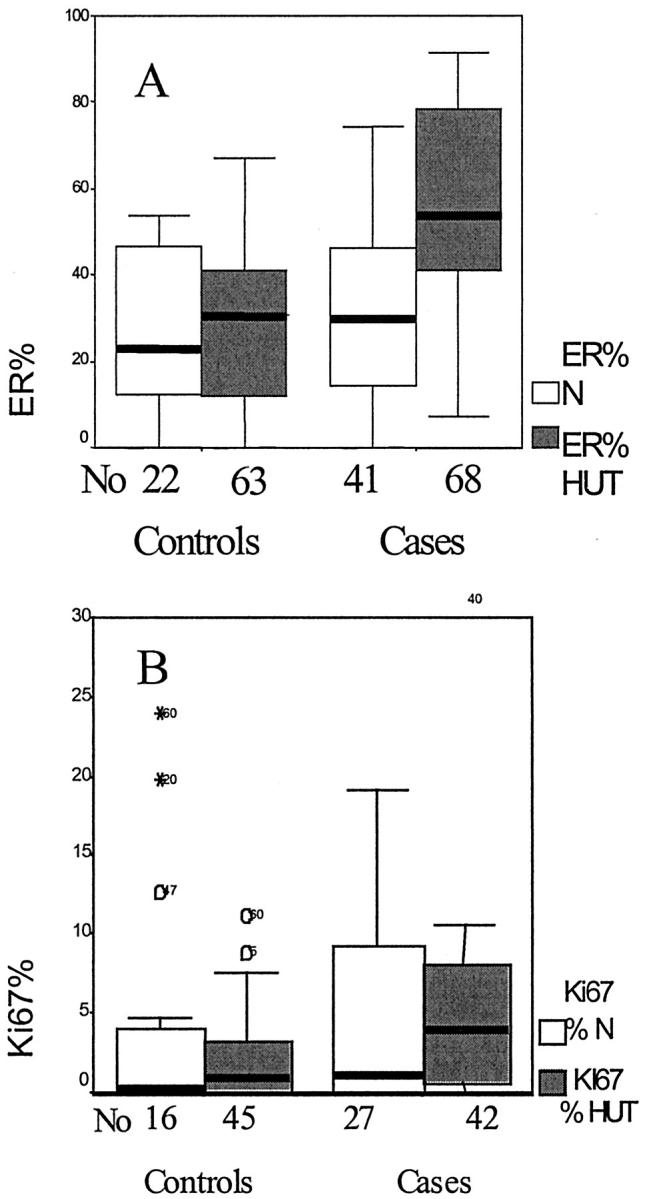
Figure 2.

Boxplot graphs, plotted for the median ER-α (A) and Ki-67 (B) percentage in normal lobules and hyperplastic foci. The boxes contain the values between the 25th and 75th percentiles, the lines across the boxes represent the medians, the whiskers extend to the highest and lowest values excluding outliers. Open circles and asterisks identify outliers and extreme values. No, the number of foci examined; N, normal lobules.
