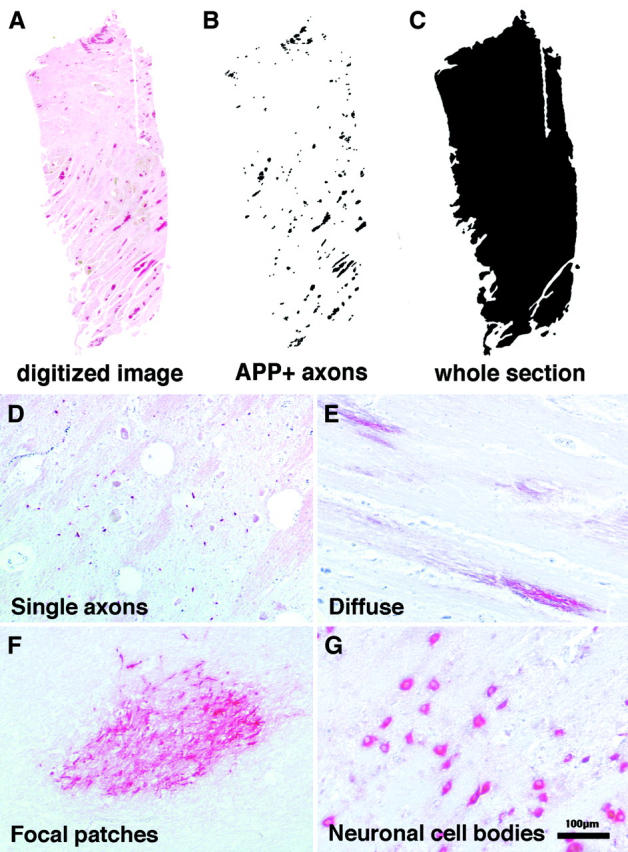
Figure 1.

A–C: Quantitation of AI or APP load. A: Tissue sections were digitized using a Nikon LS-2000 slide scanner. B: Regions of focal axonal damage were selected by density thresholding and the areas were calculated and summated using NIH image. C: The total area of the tissue section was calculated. The amount of axonal damage or APP load was expressed as the area of tissue with APP staining divided by the total area of the section. D–G: Four different patterns of β-APP staining observed in the brains of fatal P. falciparum malaria cases: single axons (D), diffuse (E), focal patches (F), and neuronal cell bodies (G).
