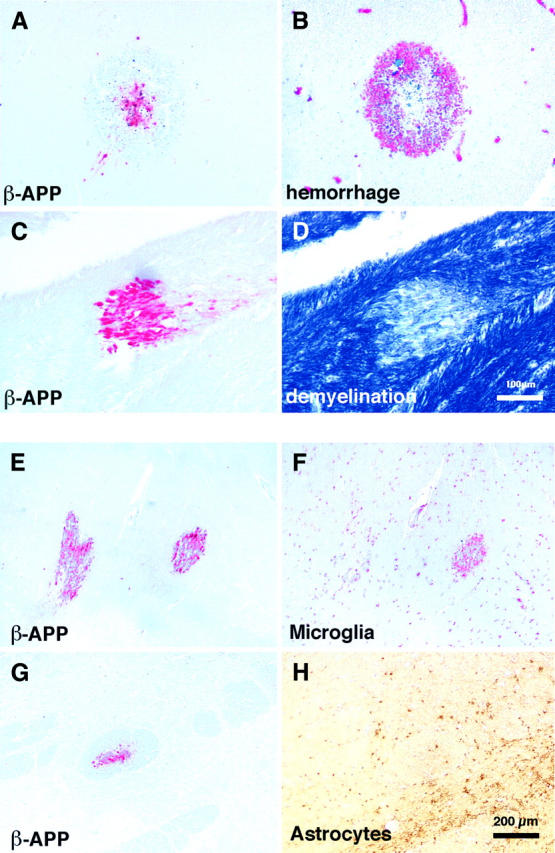
Figure 2.

A and B: Serial sections stained for either β-APP to visualize areas of AI (A) or glycophorin to identify hemorrhages (B). In this region of the brain AI was associated with the center of ring hemorrhages. C and D: Serial sections stained for β-APP to visualize areas of AI (C) or Luxol Fast Blue Cresyl Violet to identify demyelination (D). In this case AI was associated with demyelination. E and F: Serial sections stained for either β-APP to visualize areas of AI (E) or CD68 to identify microglia (F). In this region of the brain one focal region of AI was associated with a microglial response whereas the other focus only showed a mild microglial response. This suggests different ages of the axonal lesions. G and H: Serial sections stained for β-APP to visualize areas of AI (G) or an anti-GFAP antibody to identify astrocytes (H). Invariably, astrocytes did not respond to axonal lesions.
