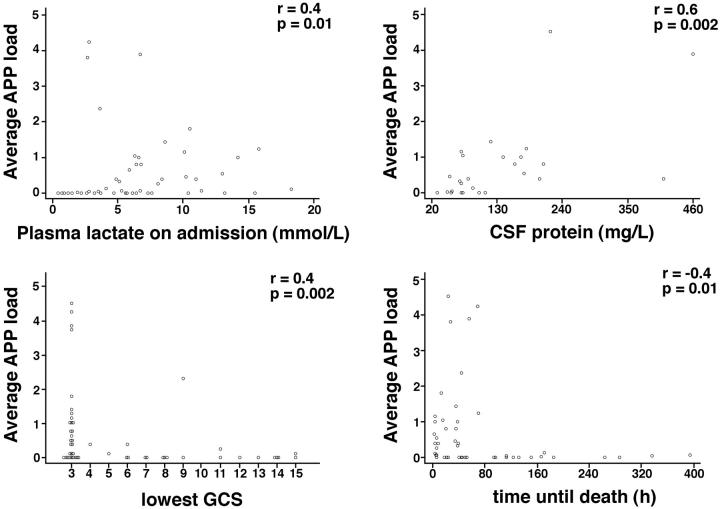
Figure 6.
Graphs showing APP load versus plasma lactate on admission, CSF protein, lowest Glasgow coma score, and time until death. Each dot represents an individual patient. APP load (%) = area of tissue covered with injured axons divided by the total area of the section. Average APP load = average of APP load found in cortex, internal capsule, pons, and cerebellum of an individual patients.

