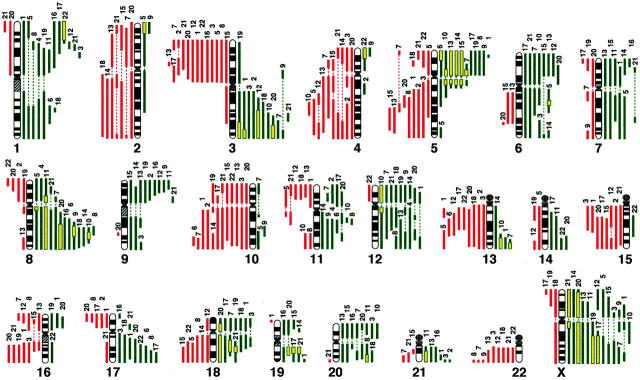
Figure 1.
Summary of genetic imbalances detected by CGH in 22 SCLC cell lines. The 22 autosomes and X chromosome are represented by ideograms showing G-banding patterns. As judged by the computerized green-to-red profiles, vertical lines on the left (red) of each chromosome ideogram show losses of genomic material in cell lines, whereas those on the right (green) correspond to copy-number gains. HLGs are represented as yellow rectangles. The number at the top of each vertical line corresponds to the cell line in which each change was recorded (see Table 1 ▶ ).

