
Figure 6.
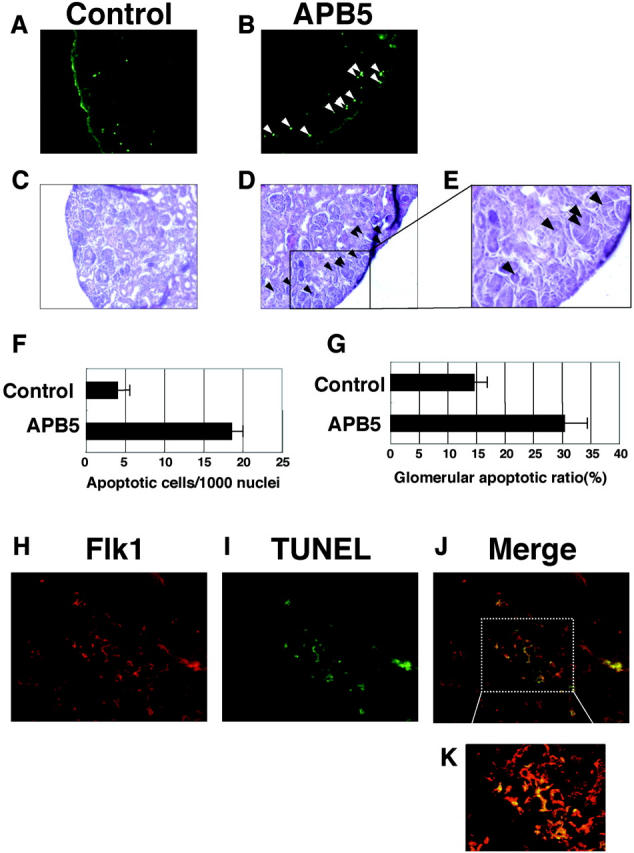
Micrographs of glomeruli stained with TUNEL and anti-Flk1 antibody. The neonatal mice were injected everyday with irrelevant IgG (A and C) or APB5 (B and D) and killed at 3 dpp. A and B: The frozen sections of the kidneys were subjected to TUNEL analysis as described in Material and Methods. The mouse kidney injected with APB5 presented a larger number of green signals (B) than the control mouse kidney (A). More than 95% of TUNEL-positive signals were exclusively detected in the glomeruli localized in the outer cortex. TUNEL signals are depicted by the white arrowheads. The sequential sections (C and D) of the TUNEL-stained slides (A and B) from control and APB5-treated mice were applied to H&E staining, respectively. In D, the TUNEL-positive cells in B are indicated by the black arrowheads. E: Magnified image of the rectangle area in D. F: Quantitative analysis of the effect of APB5 on apoptosis induction in the outer cortex (<50 μm from the surface). The number of apoptotic cells per 1000 nuclei is presented. In the mice treated with APB5 (n = 5), the proportion of apoptotic cells is increased significantly as compared to the control animal (n = 5) (P < 0.0001). Data are mean ± SD G: The ratio of the glomeruli containing TUNEL-positive cells to the total glomeruli in the cortex could be observed in the mice treated with APB5 (n = 5) or with control IgG (n = 5) (P < 0.0001). H–K: Double-histochemical preparation (Flk1 and TUNEL) of the glomeruli from the mice injected with APB5. H: The glomerular endothelial cells were stained with anti-Flk1 antibody (red; Texas red). I: Apoptotic cells were stained with TUNEL (green; fluorescein). J: Merged-image of H and I. K: High magnification of the rectangle area in J. Original magnifications: ×200 (A–D); ×400 (E, H–J); ×600 (K).