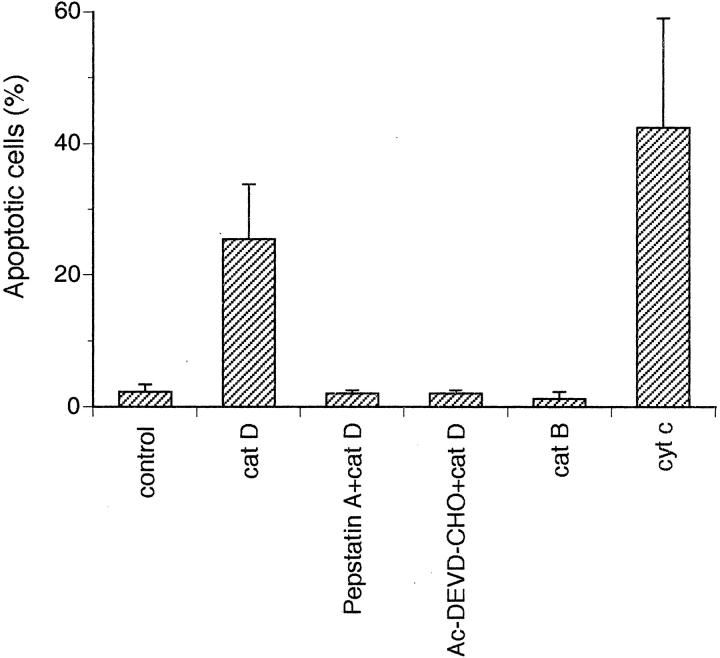
Figure 5.
The histogram shows the percentage of apoptosis detected as shrunken or detached fibroblasts by fluorescence microscopy performed 6 hours after microinjection. The fibroblasts were microinjected with Alexa Fluor alone or together with 0.25 mg/ml of cat D (active or inhibited by 5 μmol/L of pepstatin A) or pretreated with Ac-DEVD-CHO and then injected with cat D. Fibroblasts were also injected with Alexa Fluor together with 0.25 mg/ml of active cat B or 3 mg/ml of cyt c. Values represent mean percentages ± SD of apoptotic cells from at least four separate experiments.

