Figure 7.
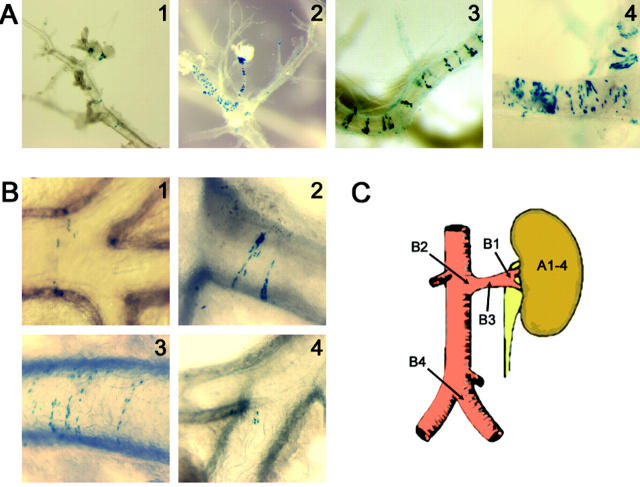
Time course of cellular β-galactosidase expression in kidney during salt depletion. β-Galactosidase localization was observed after X-gal staining followed by microdissection. A: Identification of β-galactosidase-expressing cells in the kidneys of salt-depleted mice. 1, glomerulus from kidney of mice under normal conditions; 2, glomerulus and afferent arterioles from mice kidney after 7 days of salt depletion; 3 and 4, interlobular arteries from mice kidney depleted 7 and 9 days, respectively. A recruitment of β-galactosidase-expressing cells is seen in the juxtaglomerular apparatus, along the afferent arterioles. β-Galactosidase is also expressed in interlobular artery walls in a striped pattern. B: Expression of β-galactosidase in large extrarenal arteries during salt depletion. 1, 2 and 3, renal artery after 5, 7, or 9 days of treatment; 4, iliac arteries after 12 days of salt depletion. β-Galactosidase is expressed in large arteries in the same striped pattern. Small islets of β-galactosidase-expressing cells are seen in iliac arteries after long term treatment. β-Galactosidase staining was not seen in any parts of the aorta above the renal arteries at any stage of treatment. C represents a schematic view of abdominal aorta and a renal artery. Arrows indicate localization of renin β-galactosidase-expressing cells from panel A and B pictures.

