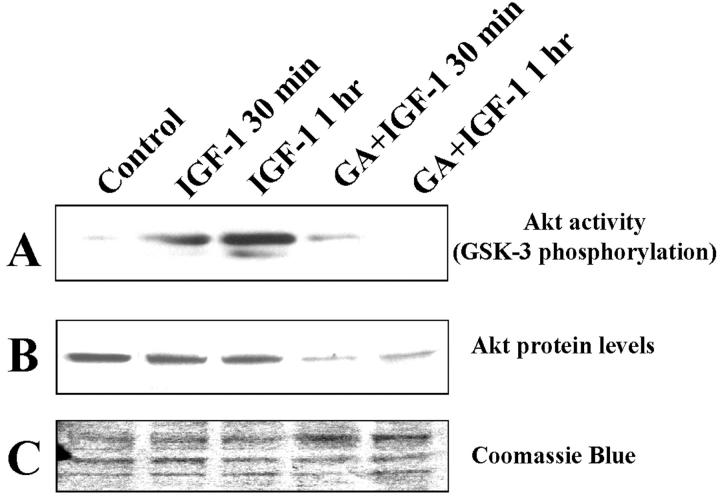
Figure 6.
Akt enzymatic activity (A) and protein levels (B) in SW579 cells after treatment with IGF-1 (100 ng/ml) for 0.5 or 1 hour, in the presence or absence of 1 μmol/L of geldanamycin (GA). Cells were pretreated with geldanamycin for 4 hours. C: Equal loading of the gel in B was confirmed by Coomassie Blue staining of the membrane.

