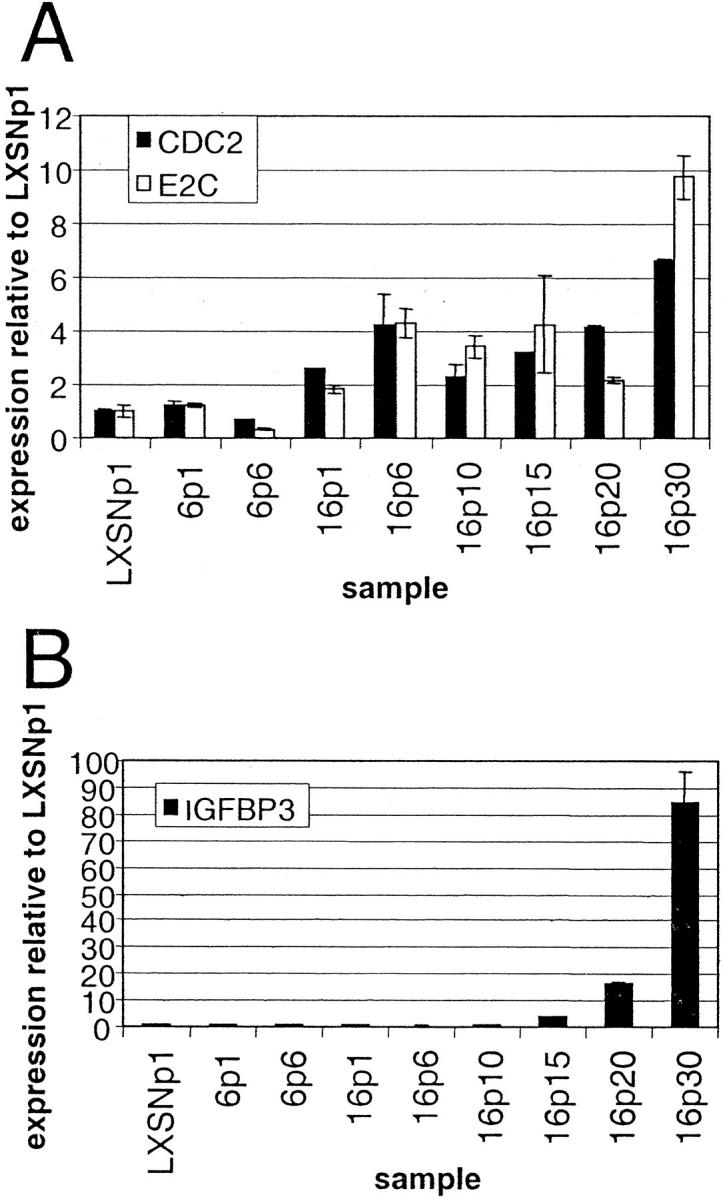
Figure 3.

Temporal changes in expression of CDC2, E2-C, and IGFBP-3 mRNA as determined by quantitative PCR using samples from infection 1. The level of mRNA expression in the indicated cervical cell samples was determined by quantitative PCR as described in Materials and Methods for CDC2 and E2-C (A) and for IGFBP-3 (B). Abbreviations indicate viral type and passage number after infection, ie, 6p1 refers to HPV-6 E6/E7 cells one passage after infection. Error bars in A and B indicate the SD between expression values from duplicate PCR reactions. Expression levels are normalized to those of LXSNp1.
