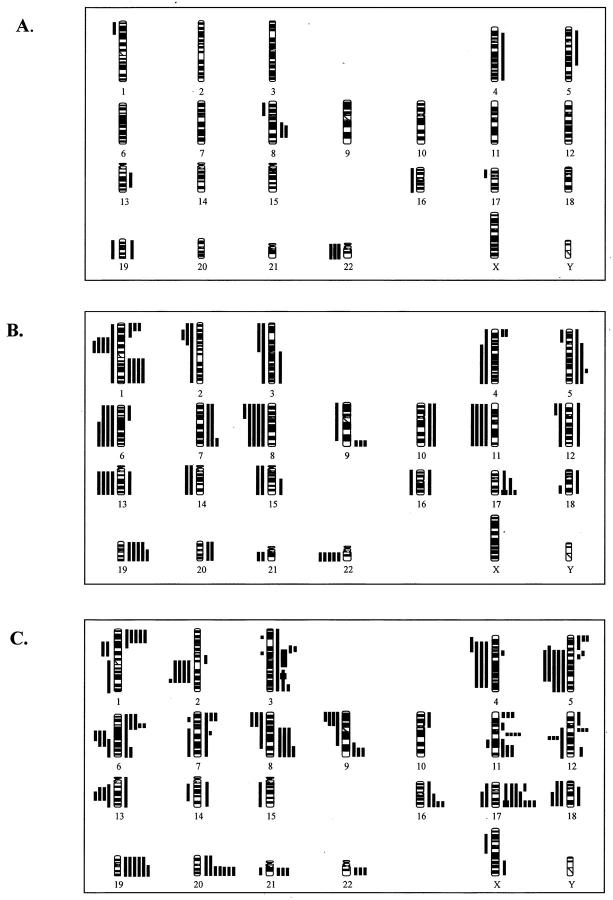
Figure 3.
Ideogram showing DNA copy number changes identified by CGH in WDTC (A), PDTC (B), and ATC (C). Thin vertical lines on either side of the ideogram indicate losses (left) and gains (right) of the chromosomal region. The chromosomal regions of the high-level amplification are shown by thick lines (right).

