
Figure 2.
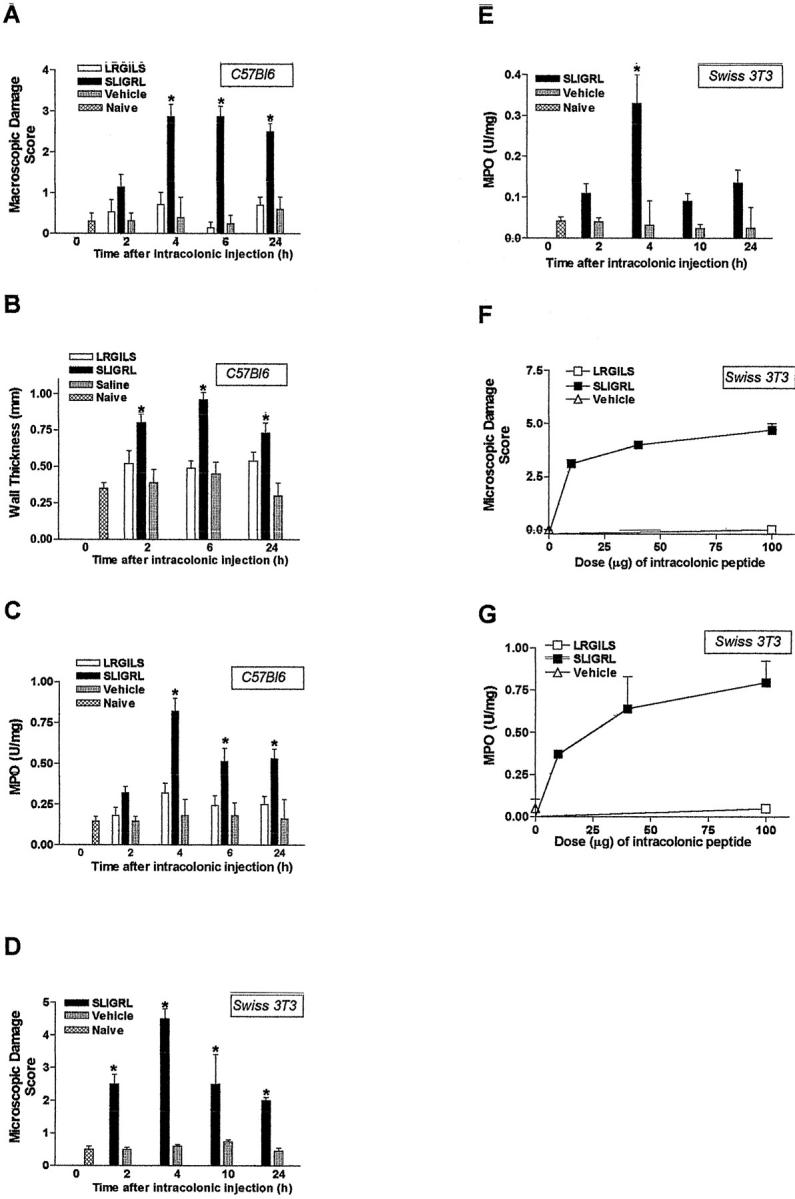
Kinetic (A–E) and dose-response curves (F and G) of inflammation induced by the intracolonic administration of the PAR-2-AP SLIGRL-NH2 (100 μg/mouse for A–E) or the control peptide LRGILS-NH2 (100 μg/mouse for A–E) in two different strains of mice: C57BL6 and Swiss 3T3. Different inflammatory parameters were followed: macroscopic (A) and microscopic (D and F) damage scores, wall thickness (B) and MPO activity (C, E, and G). Values are mean ± SEM, n = 8 per group, *, Significantly different from LRGILS-NH2-treated group, P < 0.05.