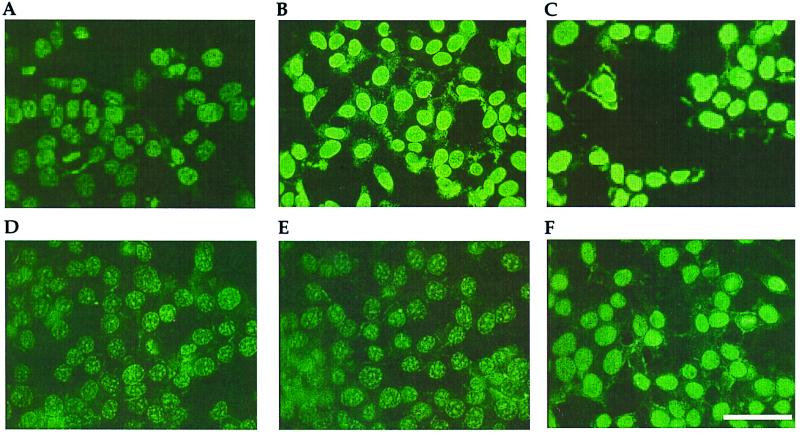
Figure 1.
HMG1 levels in hormone-treated MCF-7 and Evsa-T cells detected by immunofluorescence. (A) MCF-7 controls. (B) MCF-7 treated with 10−7 M estrogen (0.5 h). (C) MCF-7 treated with 10−6 M progesterone (0.5 h). (D) Evsa-T controls. (E) Evsa-T treated with 10−6 M progesterone (0.5 h). (F) Evsa-T treated with 10−6 M progesterone (4 h). (Bar = 50 μm.)

