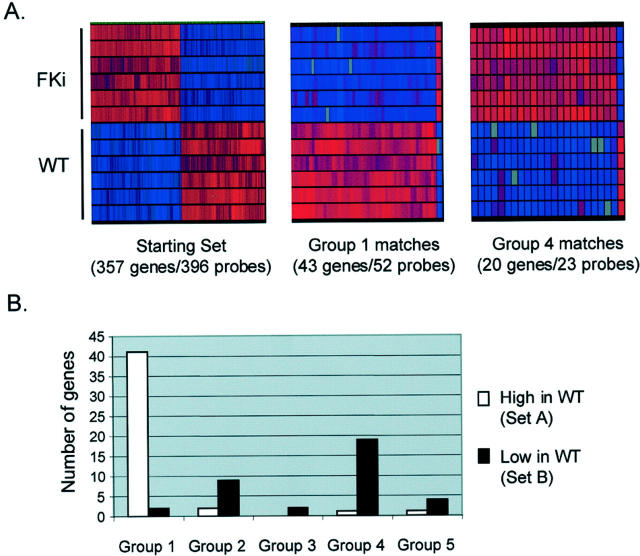
Figure 3.
Correlation of gene expression in WTs with normal kidney development in the rat. A: Genes identified in the current study that mapped to genes identified by Stuart and colleagues. 1 Genes that are more highly expressed in WTs than in whole fetal kidneys map predominantly to the earliest group of Stuart and colleagues, 1 whereas genes that are expressed at lower levels in WTs than in fetal kidneys map to the later groups. B: Graphical representations (GeneTree function, GeneSpring) showing the uniformity of relative overexpression or underexpression across multiple genes and multiple samples. Genes are arrayed along the x axis; WT and fetal kidney samples are shown on the y axis. Gene expression is automatically color-coded with red indicating higher and blue lower expression. Gray indicates Affymetrix absence calls. The group 1 matches are nearly all more highly expressed in WTs, whereas the group 4 matches are nearly all more highly expressed in fetal kidneys. Color range is set at 1 = normal, 6 = maximum.

