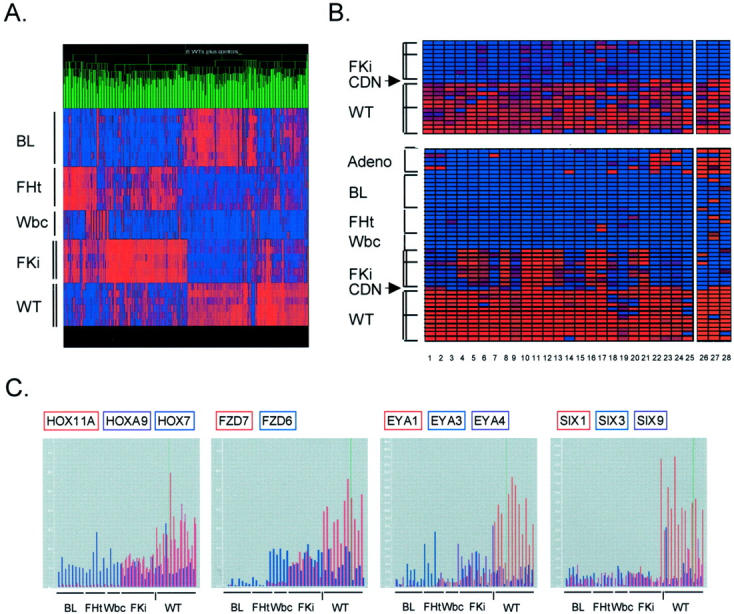
Figure 5.

Derivation of WT signature genes. A: Nonsupervised clustering (GeneTree function of GeneSpring) of the 357 genes that were initial identified as differentially expressed between WTs and fetal kidneys. Many of the high in WT/low in fetal kidney genes are also high in the BLs. The color range is normal = 1, maximum = 6. All data are included, with absence calls represented by pure blue. B: WT signature genes. The 27 highest-scoring genes identified by SPLASH are shown here, after clustering using the GeneTree function of GeneSpring (columns 1 and 2 are two probe sets both identifying CRABP2). The identities of these genes are in Table 1 ▶ . Tissues are: AdenoCA, pulmonary adenocarcinoma (six primary tumors); BL, Burkitt lymphoma (four primary tumors and four cell lines); FHt, mid-gestation fetal hearts (six samples); Wbc, normal peripheral blood (four samples); FKi, mid-gestation fetal kidneys (six samples in A and the same six samples below the dividing line in B, with three additional fetal kidneys above the line); CDN, differentiating cystic nephroblastoma (one case); WT, (six WTs in A and the same six WTs below the dividing line in B, with six additional WTs above the line). Tissues used for analysis by Genes at Work are bracketed; the adenocarcinomas were not included in deriving the WT signature genes. The genes in set C were identified by SPLASH using only data from the samples shown in A. The additional WTs and fetal kidneys, above the dividing lines, therefore validate the signature set. The differentiating cystic nephroblastoma shows a distinct pattern of gene expression. Because the data are normalized to all tissues, displaying the WT and fetal kidney samples alone (top) emphasizes the differences between them, while displaying these samples together with the heterologous tissues highlights their close affinity. Color ranges are set at 1 = normal, 6 = maximum (top) and 2 = normal, 10 = maximum (bottom). C: Differential expression of genes in the HOX-, FZD-, EYA-, and SIX-families. Microarray data are normalized to the experiment mean. Each bar represents the value for a single sample. BL, Burkitt lymphoma (eight samples); FHt, fetal heart (six samples); Wbc, peripheral blood leukocytes (four samples); FKi, fetal kidney (nine samples); WT, Wilms’ tumor (12 samples). The vertical dash indicates the single case of differentiating cystic nephroblastoma.
