
Figure 2.
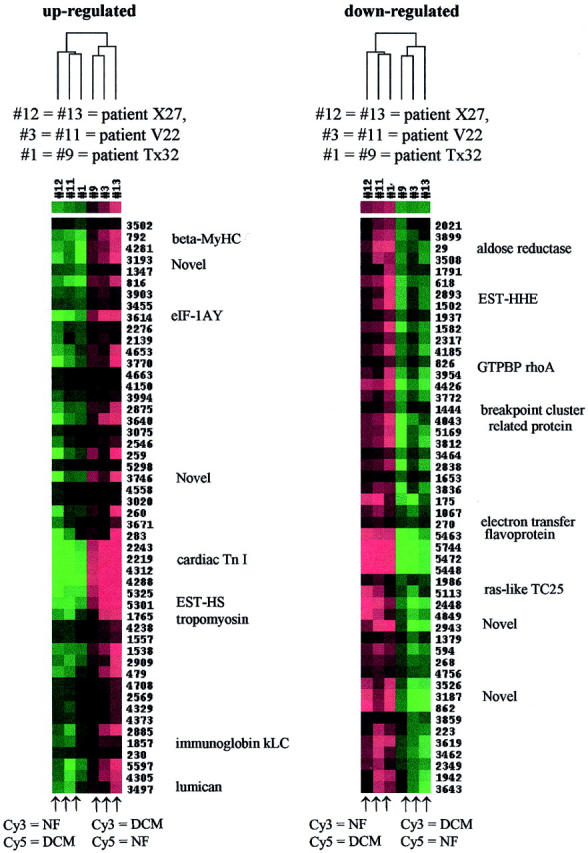
Hierarchical cluster analysis of DCM versus pooled nonfailing (NF) adult heart samples. Six slides representing three individual DCM patients (three reverse-labeled) were clustered, ie, slides 1, 11, and 12 were hybridized with DCM-Cy5-dUTP, whereas slides 3, 9, and 13 were hybridized with DCM-Cy3-dUTP. Colors represent Cy3/Cy5 ratio; red = positive ratio, green = negative ratio. A selection of genes corresponding to regions of the cluster are shown.