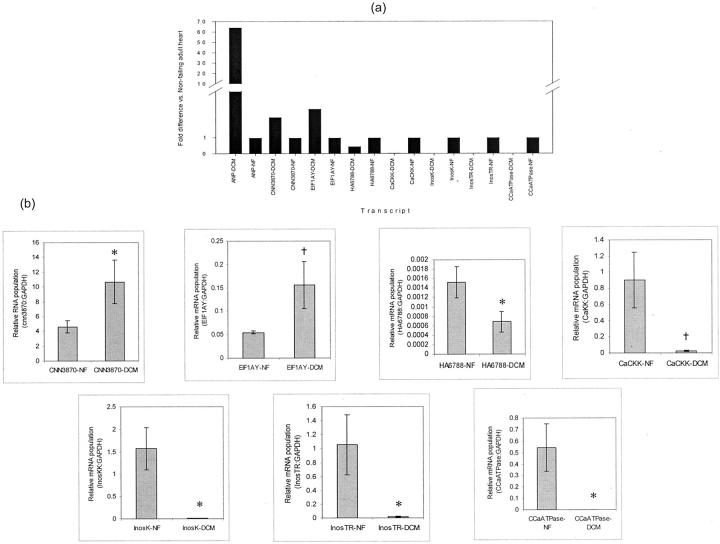
Figure 3.
Real-time RT-PCR results of selected genes identified by the microarray analysis. a: Fold difference expression of each gene in DCM heart samples relative to nonfailing (NF) samples. ANP, atrial natriuretic peptide (positive control); CNN3870 and HA6788, novel heart transcripts; EIF1AY, elongation initiation factor 1A, Y isoform; CaCKK, Ca2+/calmodulin kinase kinase; InosK, inositol 1,4,5-triphosphate-3-kinase; InosTR, inositol 1,4,5-triphosphate receptor; CCaATPase, cardiac Ca2+ ATPase. b: Mean relative mRNA population of each gene from a versus GAPDH in DCM (n = 7) and NF (n = 5) samples. †, P < 0.01; *, P < 0.05 versus NF.

