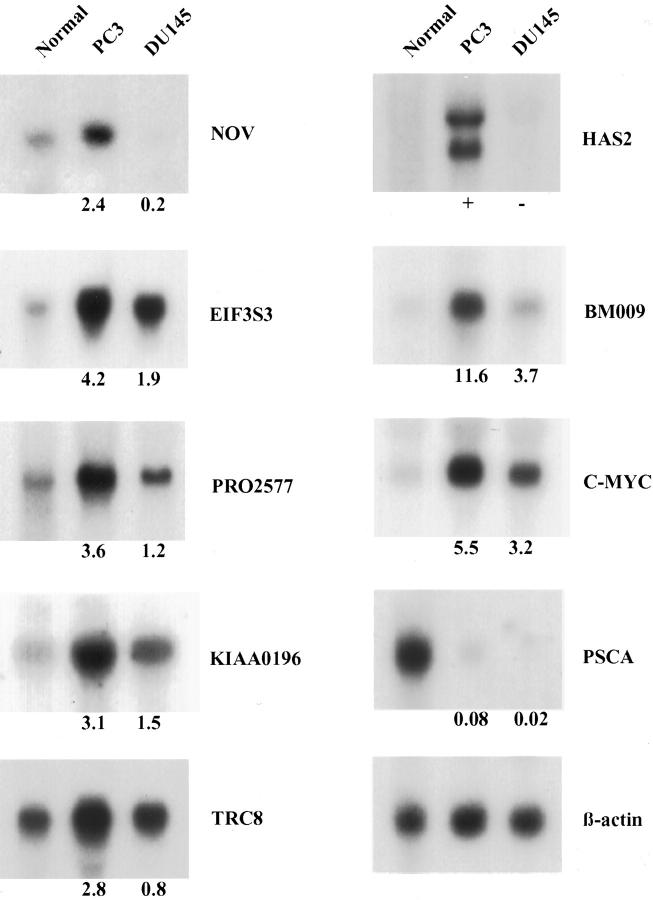
Figure 3.
Differential expression of selected known genes and ESTs for 8q23-24 in normal prostate tissue and in the PC3 and DU145 prostate cancer cell lines. Each lane contained 10 μg of total RNA from the indicated tissue or cell line. The blots were hybridized with the probes to the indicated genes/ESTs. The expression level was semiquantitated by phosphorimage analysis (PhosphorImager). Differences in loading were normalized using β-actin as a control. The number below each blot indicates the cell line/normal tissue expression ratio of each gene/EST for PC3 and DU145.

