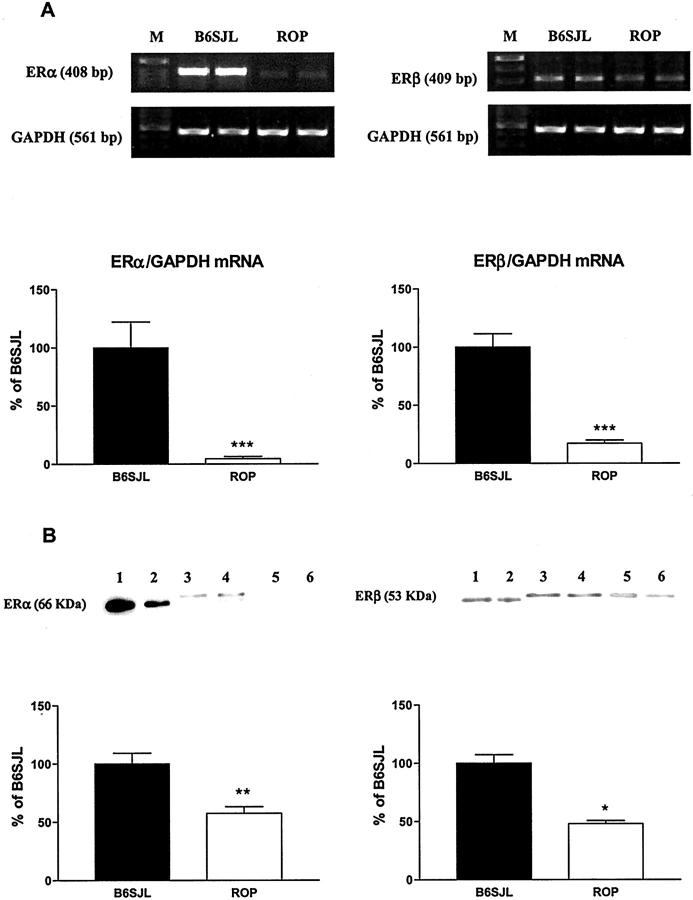
Figure 2.
MCs isolated from GS-prone mice express lower levels of ER-α and ER-β subtypes than MCs isolated from GS-resistant mice. A: Total RNA was collected from MCs grown in DMEM/F12 medium supplemented with 20% FBS. ER-α, ER-β, and GAPDH transcripts were analyzed by RT-PCR. Representative amplicons of ER-α, ER-β, GAPDH, and molecular weight standards (M) were run in parallel. Graphs show ER-α (left) and ER-β (right) mRNA expression normalized to GAPDH. Data are expressed as percentage of MCs isolated from B6SJL mouse. Shown are means ± SEM of three independent experiments. ***, P < 0.001. B: Mouse MC homogenates (ER-α) or immunoprecipitates (ER-β) were analyzed by Western blotting using the ER-α MC-20 antiserum and the ER-β Y-19 antiserum, respectively. Twenty μg of MC homogenates or 25 μl of ER-β immunoprecipitates were loaded, respectively. The 66-kd human recombinant ER-α peptide (10 ng and 5 ng) and the 53-kd human recombinant ER-β peptide (1 μg and 0.5 μg) served as positive controls (lanes 1 and 2). Signals corresponding to the molecular weight of the wild-type ∼67-kd mouse ER-α, the ∼55-kd ER-β for B6SJL-derived MCs (lanes 3 and 4), and from ROP-derived MCs (lanes 5 and 6) were detected in the immunoblots. Graphs show ER-α (left) and ER-β (right) protein expression. Data are expressed as percentage of MCs isolated from B6SJL mouse. Shown are means ± SEM of three independent experiments. Statistical significance is indicated by * and ** (P < 0.05 and P < 0.01, respectively) when compared to MCs isolated from B6SJL mouse.

