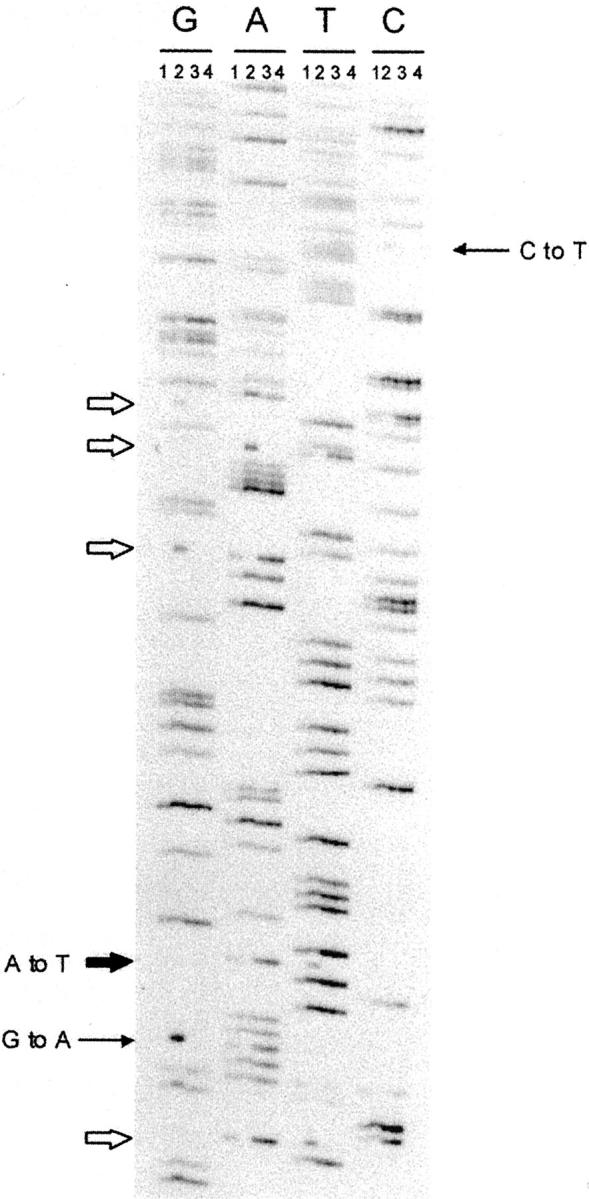
Figure 2.

Sequencing for EBNA3C CTL epitopes. Lane 1, case 8; lane 2, case 2, type B EBV; lane 3, case 3a; lane 4, case 3b. The variations between type A and B EBV are shown by thick arrows including one missense mutation (A to T) within a CTL epitope (filled thick arrow). Two mutations (one silent C to T, one missense G to A) among type A EBV isolates are shown by thin arrows.
