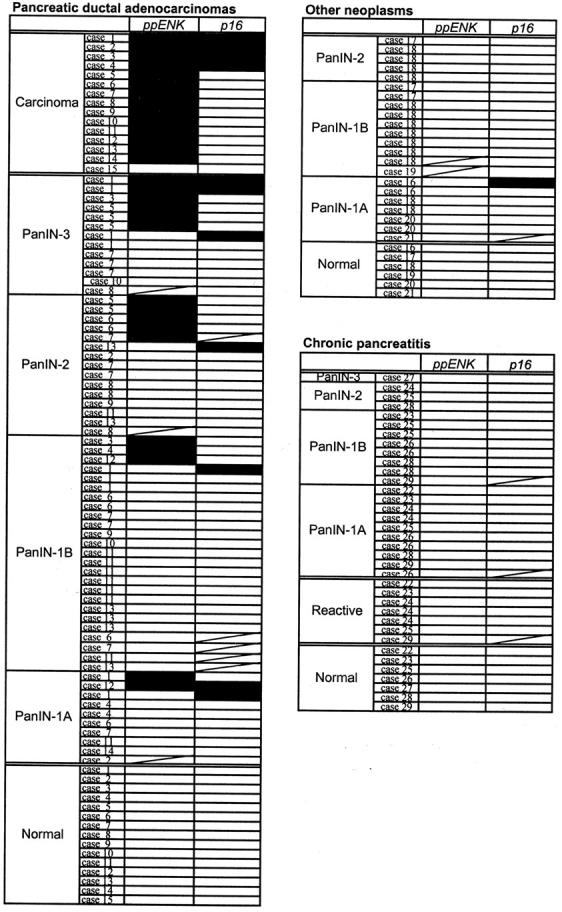
Figure 3.

Methylation profiles of the ppENK and p16 genes in PanINs. The PanINs that were unable to be amplified were not included in this figure. Filled boxes, methylated results; open boxes, unmethylated results.

Methylation profiles of the ppENK and p16 genes in PanINs. The PanINs that were unable to be amplified were not included in this figure. Filled boxes, methylated results; open boxes, unmethylated results.