Figure 4.
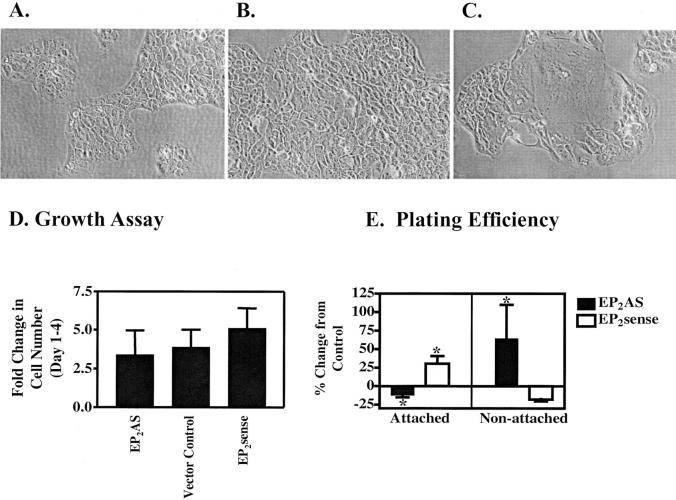
Tissue culture morphology, growth rates, and plating efficiency of EP2 sense/AS clones. Photomicrographs of representative empty vector Mirb clone (M5) (A), EP2 sense clone (S2) (B), and EP2AS clone (AS8) (C) grown on tissue culture plastic. D: Growth rates were determined for clonal populations of HaCat cells overexpressing sense or anti-sense (AS) EP2 receptor constructs compared with empty vector controls. Cells were counted at day 1 and at day 4 after plating. Results are expressed as the mean and SD for the fold change in cell number from day 1 through 4. The data represents a single representative experiment done in triplicate (values = 3.41 ± 1.53, 3.89 ± 1.12, and 5.12 ± 1.28 for EP2AS, vector controls, and EP2 sense clones, respectively). E: Plating efficiency was determined by counting both attached and nonattached cells after an overnight incubation on tissue culture plates. For cellular attachment, the results represent the mean and SE for four separate experiments for EP2AS clones and six separate experiments for EP2 sense clones done in duplicate or triplicate wells (*, P < 0.05). The data for nonattached cells represents mean and SD for a single experiment done in triplicate for EP2AS clones (P < 0.05) and the mean and SE for two separate experiments for EP2 sense clones (P = 0.053). Original magnifications, ×200 (A–C).

