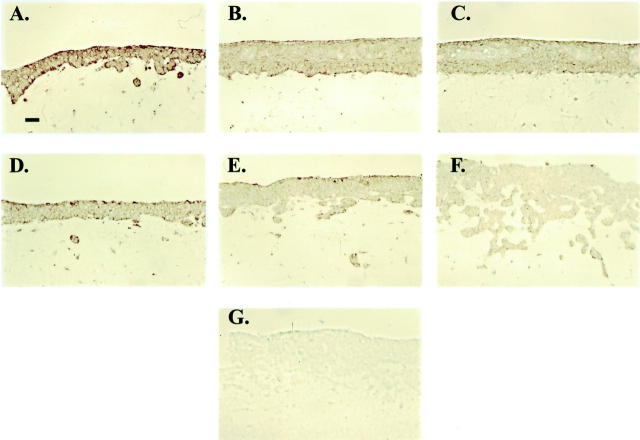
Figure 8.
Pharmacological down-regulation of EP2 receptor expression by agonist exposure. Representative photomicrographs demonstrating EP2 receptor expression by immunohistochemical staining in skin equivalents prepared with an EP2 sense clone (A–C) and a vector control clone (D–F). The clones were treated with vehicle alone (A and D), 0.1 μg/ml butaprost (B and E), or 1 μg/ml butaprost (C and F). G: Immunoglobulin-isotype (mouse IgG2a-κ) negative control. Original magnifications, ×200.

