
Figure 6.
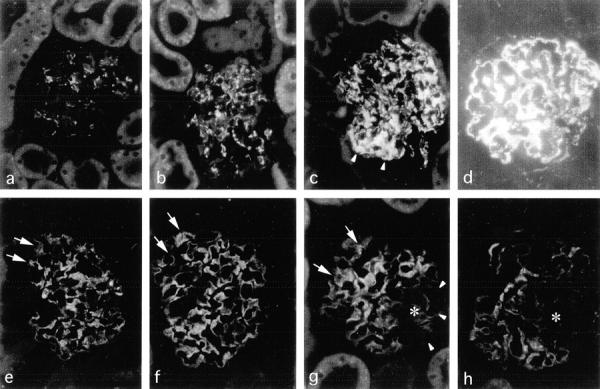
Immunofluorescence detection of desmin (a–d) and synaptopodin (e–h) in RMR glomeruli. In contrast to normal patterns revealed in sham control (a and e) and RMR at 7 days (b and f), high desmin expression and loss of synaptopodin in podocytes are visualized in RMR at 14 days (c and g, arrowheads) and 30 days (d and h) after surgery. In respect to areas in which synaptopodin is preserved (arrows), the asterisks indicate well-defined areas in which the foot process-associated differentiation marker is lost. Original magnifications, ×250.